Is the Holiday Spirit Contagious?
During Ippon's first Data Hackathon in December 2020, the Data Practice set out to find the effect of holidays on COVID-19 case count after typically large gatherings on holidays like the 4th of July or even non-official ones, like Black Friday, and as a function of geo-location, voter registration, and local preventative measures.
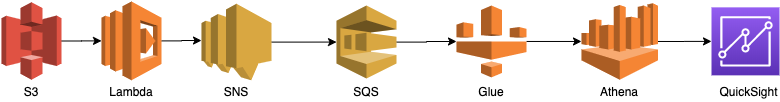
We had two brief planning sessions to identify the objective, scope, tech stack, data sources, and to organize into smaller groups to tackle the work using, in true Hackathon spirit, a Python script developed on the spot! A high-level architecture included AWS S3, Lambda, SNS, SQS, and Glue using AWS Athena and QuickSight, and Scala.
Data sources included
- COVID-19 Case Counts by state for 2020 Source
- Holiday List
- Voter Data Registration by State used for state population data
All hands-on keyboard work was saved for the Hackathon Day itself. A quick meeting with our Data Practice Manager, Peter Choe, where he reiterated the driving principles of "Learn-Something-New-and-Have-Fun" and we were off!
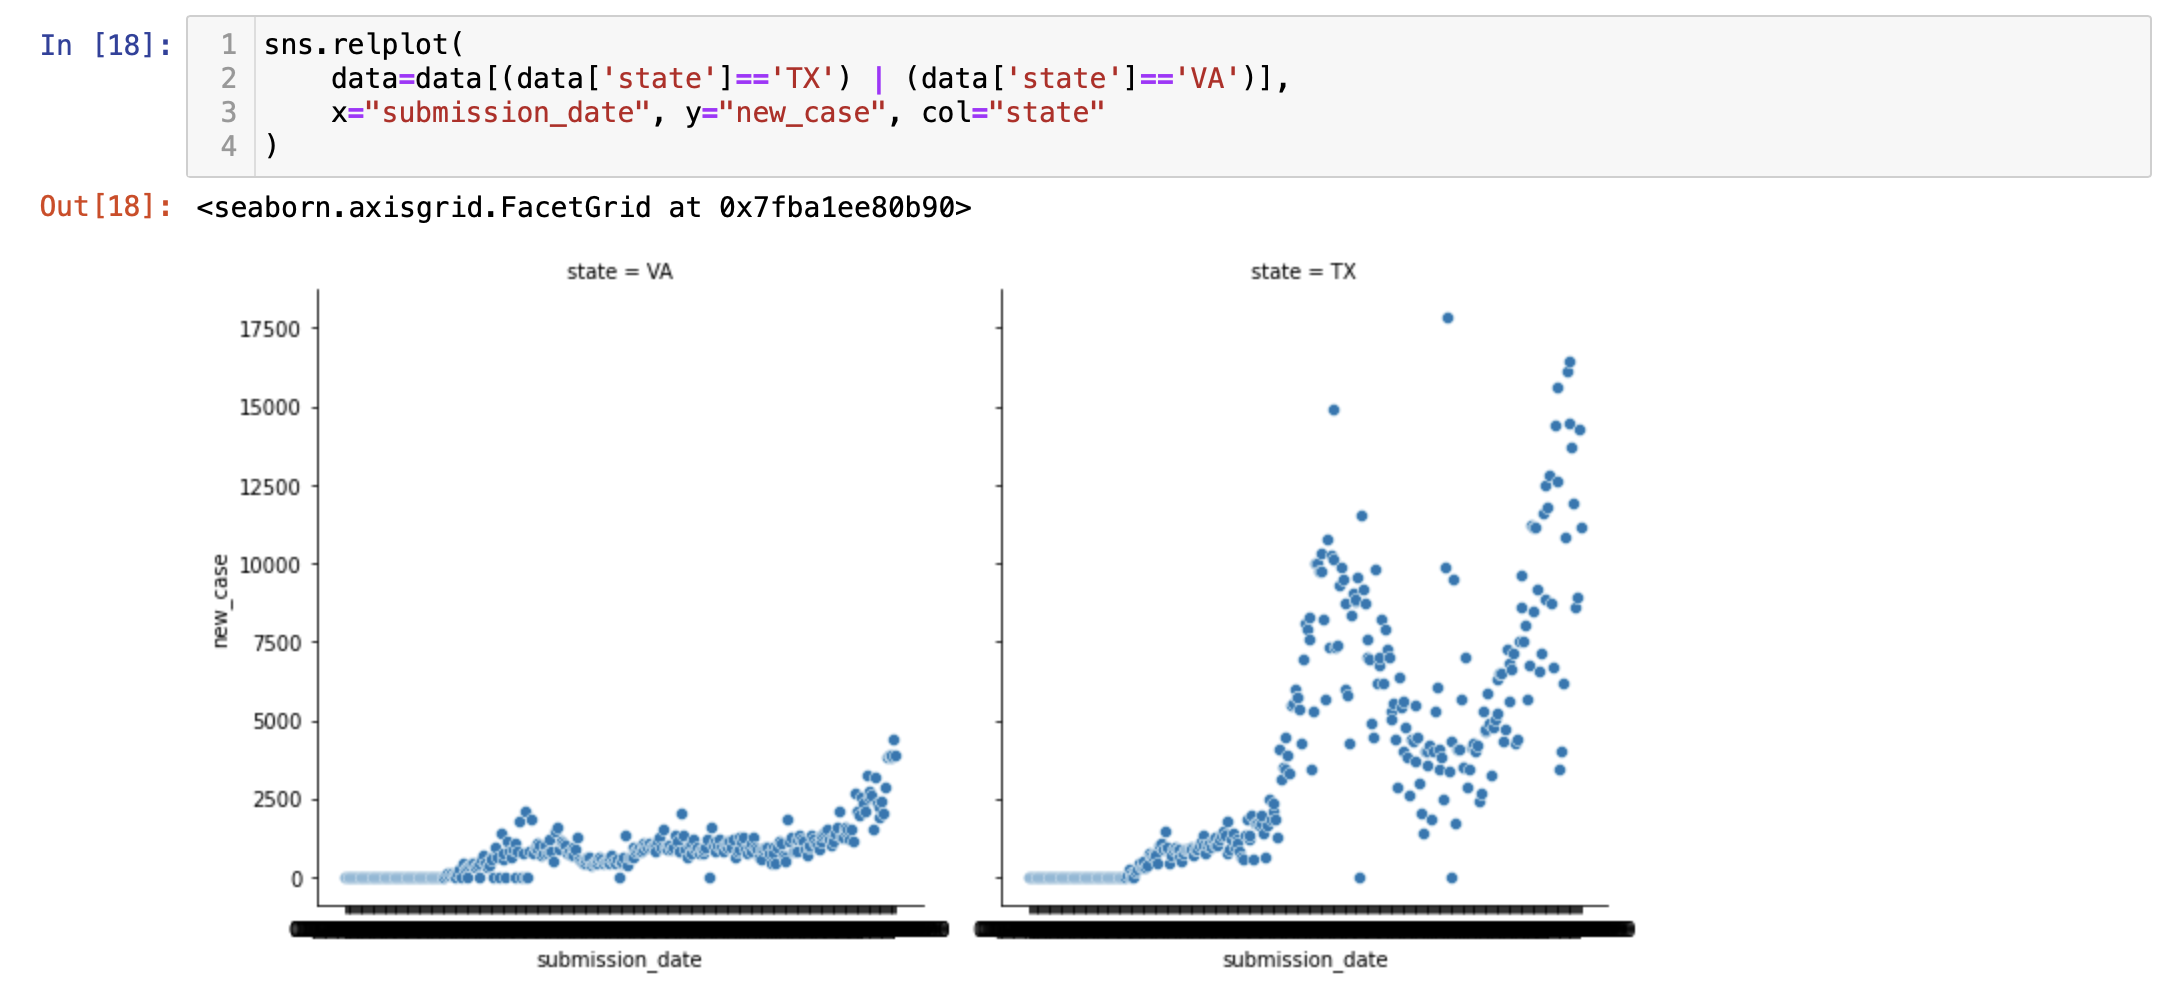
Teams worked in parallel using S3 datasets, a Lambda function to call APIs to get the most up-to-date COVID-19 data, and creating an SNS with the parameters to invoke the Glue job. The second team leveraged the CloudFormation template to create SQS messages. The third team used Glue crawler to parse out the JSON datasets and Glue in Scala to transform the datasets into the target data model. This team was the largest with the biggest scope of work. Meanwhile, the team working on visualization, created a mock test data for the QuickSight dashboard and then used Python Seaborn to show COVID-19 cases by state over time.
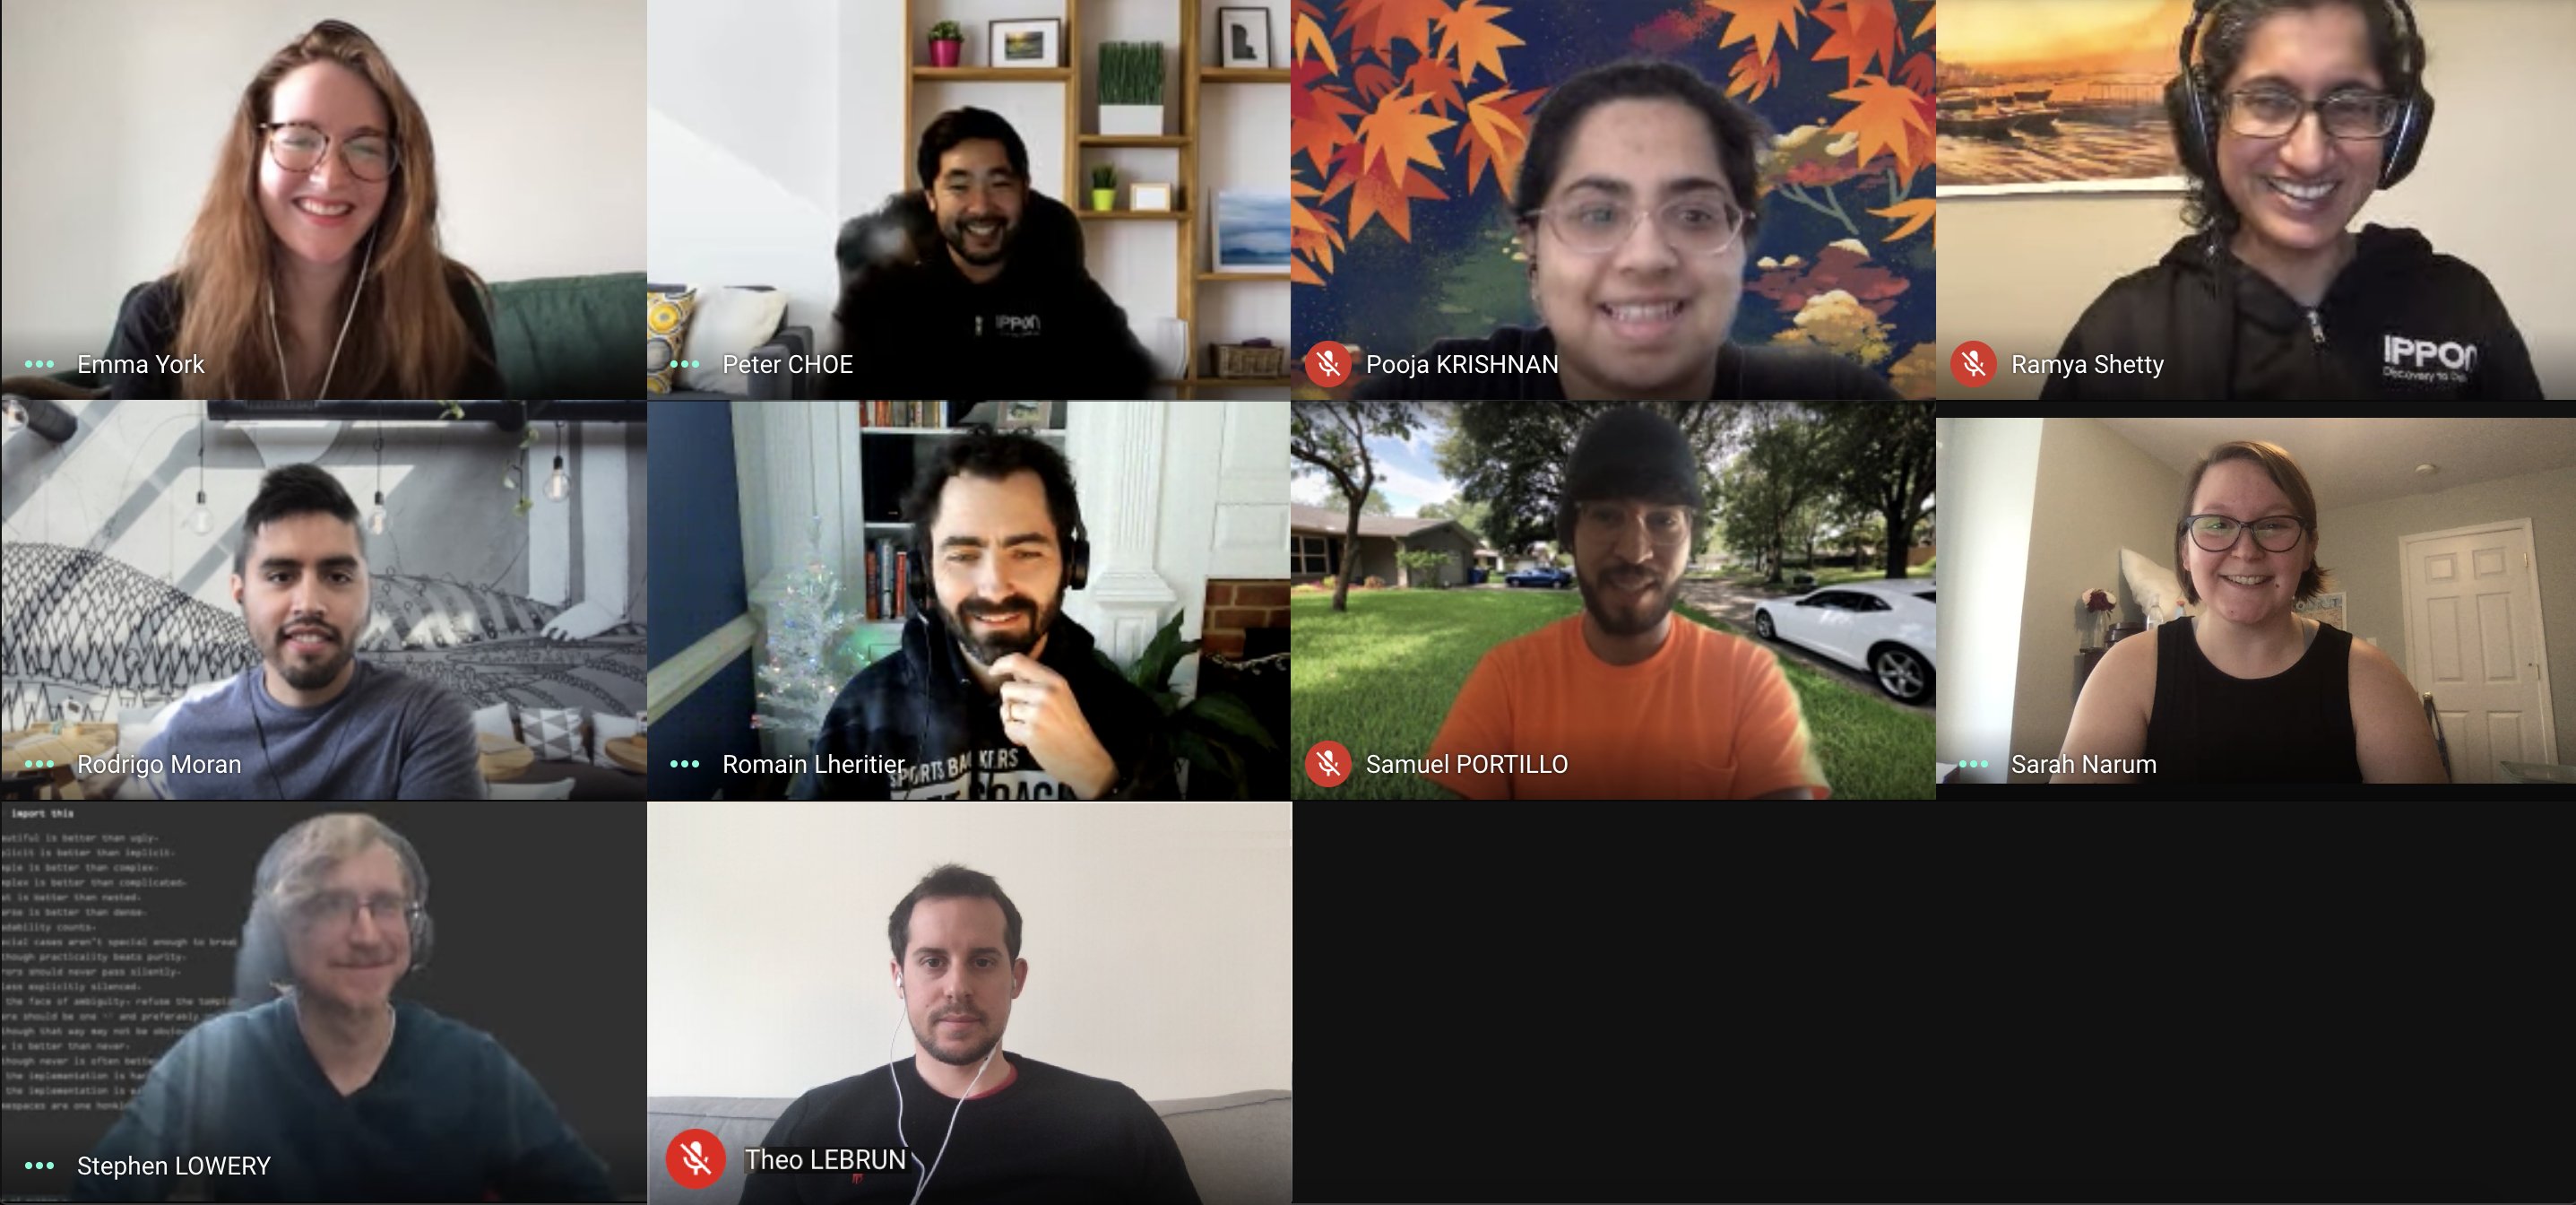
Google Meet with its breakout rooms and a Slack channel were crucial in helping the group and then smaller teams communicate and brought us together in this virtual Hackathon.
It was a data project compressed into one day with all the usual challenges, time being the biggest. Rome (and an entire data pipelines) was not built in a day! There were hiccups along the way (as always!) with datasets, visualization, and working with a tech stack that was new to some of us. But in true Ipponite fashion, we learned quickly, worked together as a team, adapted, and helped each other resolve issues.
The team shared their findings and process in a company-wide presentation to mark the end of an exciting Data Hackathon. The visualizations below show a definite uptick in the days following exposure on holidays like July 4th that involve large gatherings --
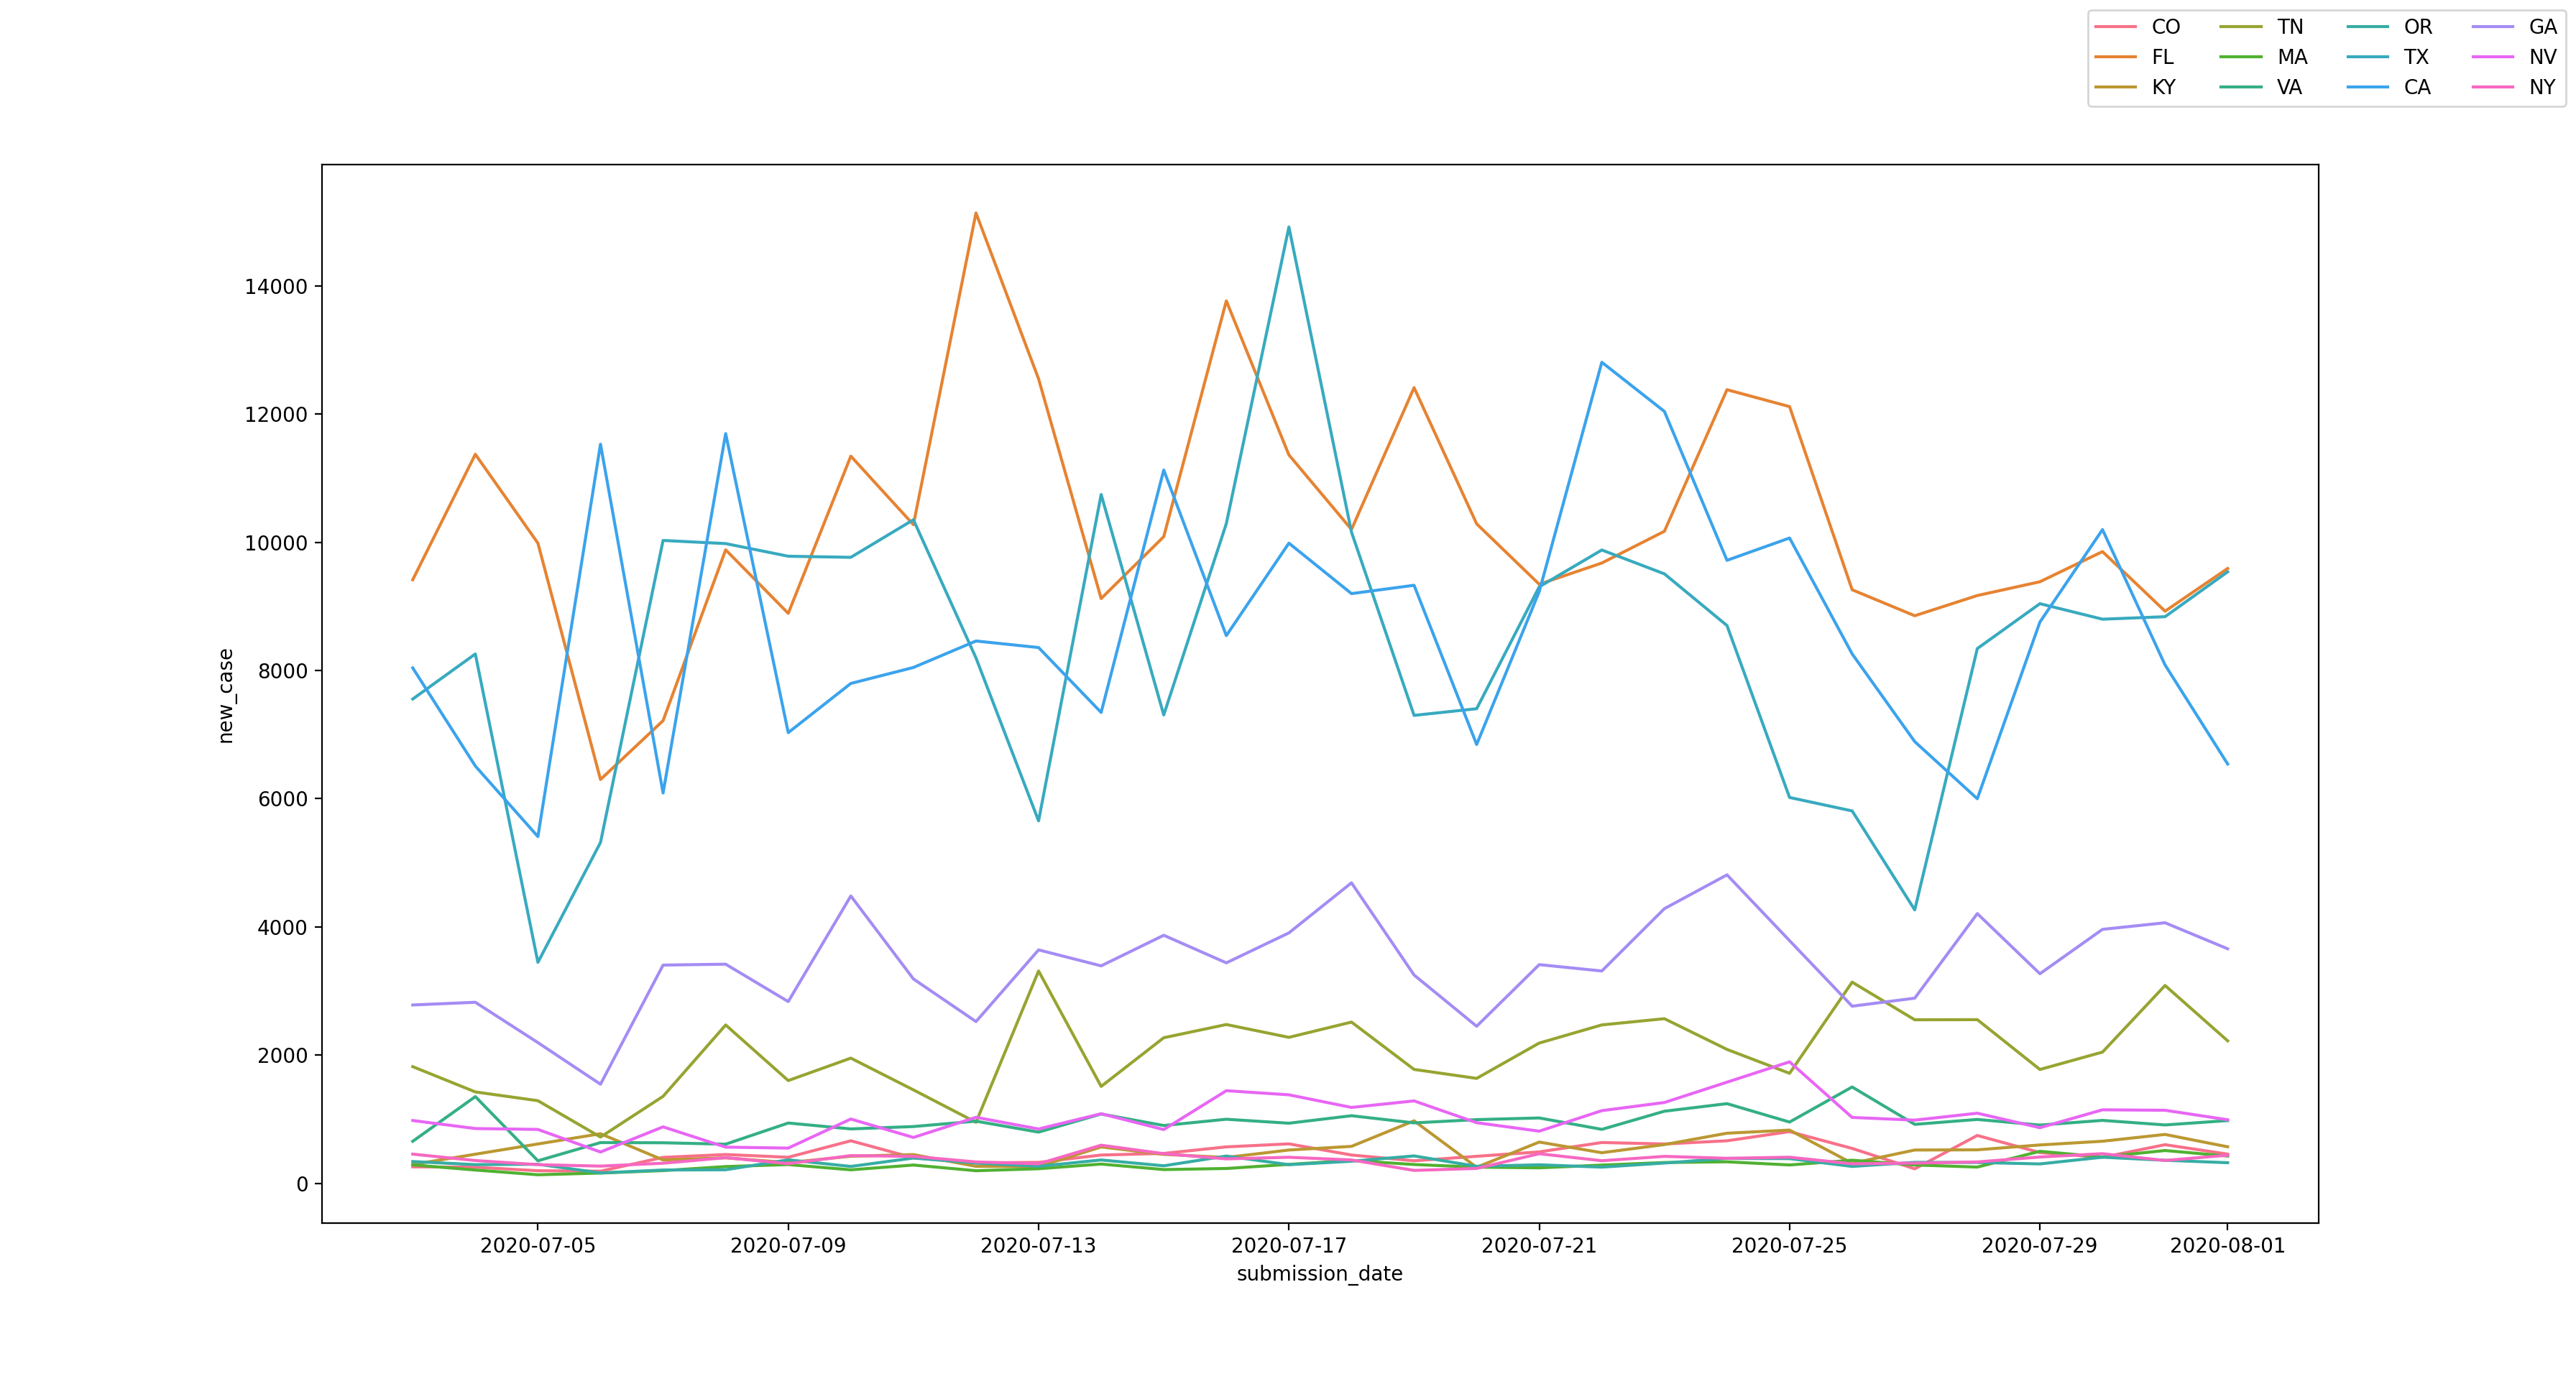
Comparing across states over time, we also notice the difference in the curve based on the state measures to flatten the curve --
During the Data Hackathon, we had the opportunity to spend the entire day learning new technologies, sharpening our skills, working together with colleagues from different projects as a team, and with lessons learnt and ideas to improve, we are all so excited for the next one. Stay tuned!

Comments