Architects and IT operations now require operational visibility into their entire architecture.
On AWS we can use distributed tracing services, such as AWS X-Ray, to collect and record traces as requests travel through the application, generate maps to see how requests flow across services, gain insight on the relationships between components, as well as identify and analyze issues in real time.
Integrate X-Ray to a Spring Boot application
In this article we will see how we can setup distributed tracing for a sample application written in Spring Boot.
This is how it works:
- The application need to implement the X-Ray Java SDK which generates and sends the tracing data to a X-Ray daemon service
- The X-Ray daemon service will then send the data to the AWS X-Ray API
- Tracing data is available on the AWS X-Ray Service Console
Maven dependencies
We need first to add the AWS X-Ray Java SDK to our pom.xml.
    <dependency>
			<groupId>com.amazonaws</groupId>
			<artifactId>aws-xray-recorder-sdk-core</artifactId>
			<version>2.8.0</version>
		</dependency>
		<dependency>
			<groupId>com.amazonaws</groupId>
			<artifactId>aws-xray-recorder-sdk-apache-http</artifactId>
			<version>2.8.0</version>
		</dependency>
		<dependency>
			<groupId>com.amazonaws</groupId>
			<artifactId>aws-xray-recorder-sdk-aws-sdk</artifactId>
			<version>2.8.0</version>
		</dependency>
		<dependency>
			<groupId>com.amazonaws</groupId>
			<artifactId>aws-xray-recorder-sdk-aws-sdk-v2</artifactId>
			<version>2.8.0</version>
		</dependency>
		<dependency>
			<groupId>com.amazonaws</groupId>
			<artifactId>aws-xray-recorder-sdk-aws-sdk-instrumentor</artifactId>
			<version>2.8.0</version>
		</dependency>
		<dependency>
			<groupId>com.amazonaws</groupId>
			<artifactId>aws-xray-recorder-sdk-aws-sdk-v2-instrumentor</artifactId>
			<version>2.8.0</version>
		</dependency>
		<dependency>
			<groupId>com.amazonaws</groupId>
			<artifactId>aws-xray-recorder-sdk-spring</artifactId>
			<version>2.8.0</version>
		</dependency>
Tracing incoming requests
To trace all incoming requests to our microservice, first we configure a Servlet Filter provided by the SDK. Then we add the Servlet to our Spring configuration.
  ``` java
  @Configuration
  public class AwsXRayConfig {

    @Bean
    public Filter TracingFilter() {
      return new AWSXRayServletFilter("micro1-app");
    }
  }
  ```
After adding the X-Ray servlet filter to our application, the X-Ray SDK for Java creates a segment for each incoming request with an http block that contains the following information:
- HTTP method: GET, POST, PUT, DELETE, etc.
- Client address: The IP address of the client that sent the request.
- Response code: The HTTP response code for the completed request.
- Timing: The start time (when the request was received) and end time (when the response was sent).
- User agent: The user-agent from the request.
- Content length: The content-length from the response.
Tracing your spring bean components
The X-Ray SDK offers a non-invasive Spring integration way of tracing our Spring beans. This help us see the complete call stack of the application from the controller down through the back-end layers.
-
We need to add first a spring AOP Aspect that will catch your method's execution and generate your tracing metadata:
@Aspect @Component public class XRayInspector extends BaseAbstractXRayInterceptor { @Override protected Map<String, Map<String, Object>> generateMetadata(ProceedingJoinPoint proceedingJoinPoint, Subsegment subsegment) { return super.generateMetadata(proceedingJoinPoint, subsegment); } @Override @Pointcut("@within(com.amazonaws.xray.spring.aop.XRayEnabled) && bean(*)") public void xrayEnabledClasses() { } } -
Let's annotate the spring components that we want to trace:
@Component
@XRayEnabled
public class HelloService {

    public String greetingHello() {
        return "Hello from micro 1 service";
    }
}
The @XRayEnabled annotation can be used on the class or method level for more fine-grained control.
Tracing your outbound HTTP calls
When making external calls to API's, we will need to use the AWS X-Ray Apache library which act as a wrapper to the Apache HttpComponents. This is the only time when we may have an impact on the existing code, especially if another HTTP client is used other than Apache like Spring Rest Template or HTTP Client (available since Java 11).
``` java
import com.fasterxml.jackson.databind.ObjectMapper;
import org.apache.http.HttpEntity;
import org.apache.http.client.methods.CloseableHttpResponse;
import org.apache.http.client.methods.HttpGet;
import org.apache.http.impl.client.CloseableHttpClient;
import org.apache.http.util.EntityUtils;
import com.amazonaws.xray.proxies.apache.http.HttpClientBuilder;

  public String externalApiCall() throws IOException {
    CloseableHttpClient httpclient = HttpClientBuilder.create().build();
    HttpGet httpGet = new HttpGet("http://names.example.com/api/");
    CloseableHttpResponse response = httpclient.execute(httpGet);
    try {
      HttpEntity entity = response.getEntity();
      InputStream inputStream = entity.getContent();
      // consume the response
      return response;
    } finally {
      response.close();
    }
  }
```
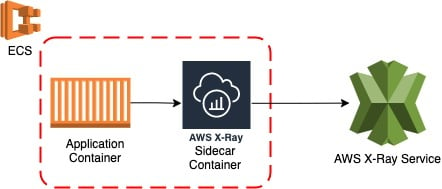
Run the AWS X-Ray daemon as a side container on Amazon ECS
Before to deploy our microservice on AWS ECS, we need to setup the AWS X-Ray Daemon.
In this example the X-Ray Daemon will be running as a Sidecar Container using the X-Ray-Daemon container provided by AWS.
Our ECS task will have then two container definitions when the application container will send trace data on localhost:2000 to the X-Ray Daemon container.
We also need to give the task role permission to contact the AWS X-Ray API:
```json
  {
    "family": "micro1",
    "executionRoleArn": "arn:aws:iam::9666461757999:role/ecsTaskExecutionRole",
    "taskRoleArn": "arn:aws:iam::926646175999:role/xray-daemon-write",
    "containerDefinitions": [
      {
        "name": "xray-daemon",
        "image": "amazon/aws-xray-daemon",
        "cpu": 32,
        "memoryReservation": 256,
        "logConfiguration": {
          "logDriver": "awslogs",
          "options": {
            "awslogs-group": "/ecs/group1",
            "awslogs-region": "us-east-2",
            "awslogs-stream-prefix": "ecs"
          }
        },
        "portMappings": [
          {
            "hostPort": 2000,
            "containerPort": 2000,
            "protocol": "udp"
          }
        ]
      },
      {
        "name": "micro1-container",
        "image": "9666461757999.dkr.ecr.us-east-2.amazonaws.com/micro1:65435390a2d95f73f6f379cb63338a305641987ba",
        "cpu": 512,
        "portMappings": [
          {
            "hostPort": 8888,
            "protocol": "tcp",
            "containerPort": 8888
          }
        ],
        "memory": 1024,
        "essential": true,
        "logConfiguration": {
          "logDriver": "awslogs",
          "options": {
            "awslogs-group": "/ecs/group1",
            "awslogs-region": "us-east-2",
            "awslogs-stream-prefix": "ecs"
          }
        }
      }
    ],
    "requiresCompatibilities": [
      "FARGATE"
    ],
    "networkMode": "awsvpc",
    "cpu": "1024",
    "memory": "2048"
  }

```
Please checkout this article on how to deploy a Spring Boot microservice on Amazon ECS using Github Actions.
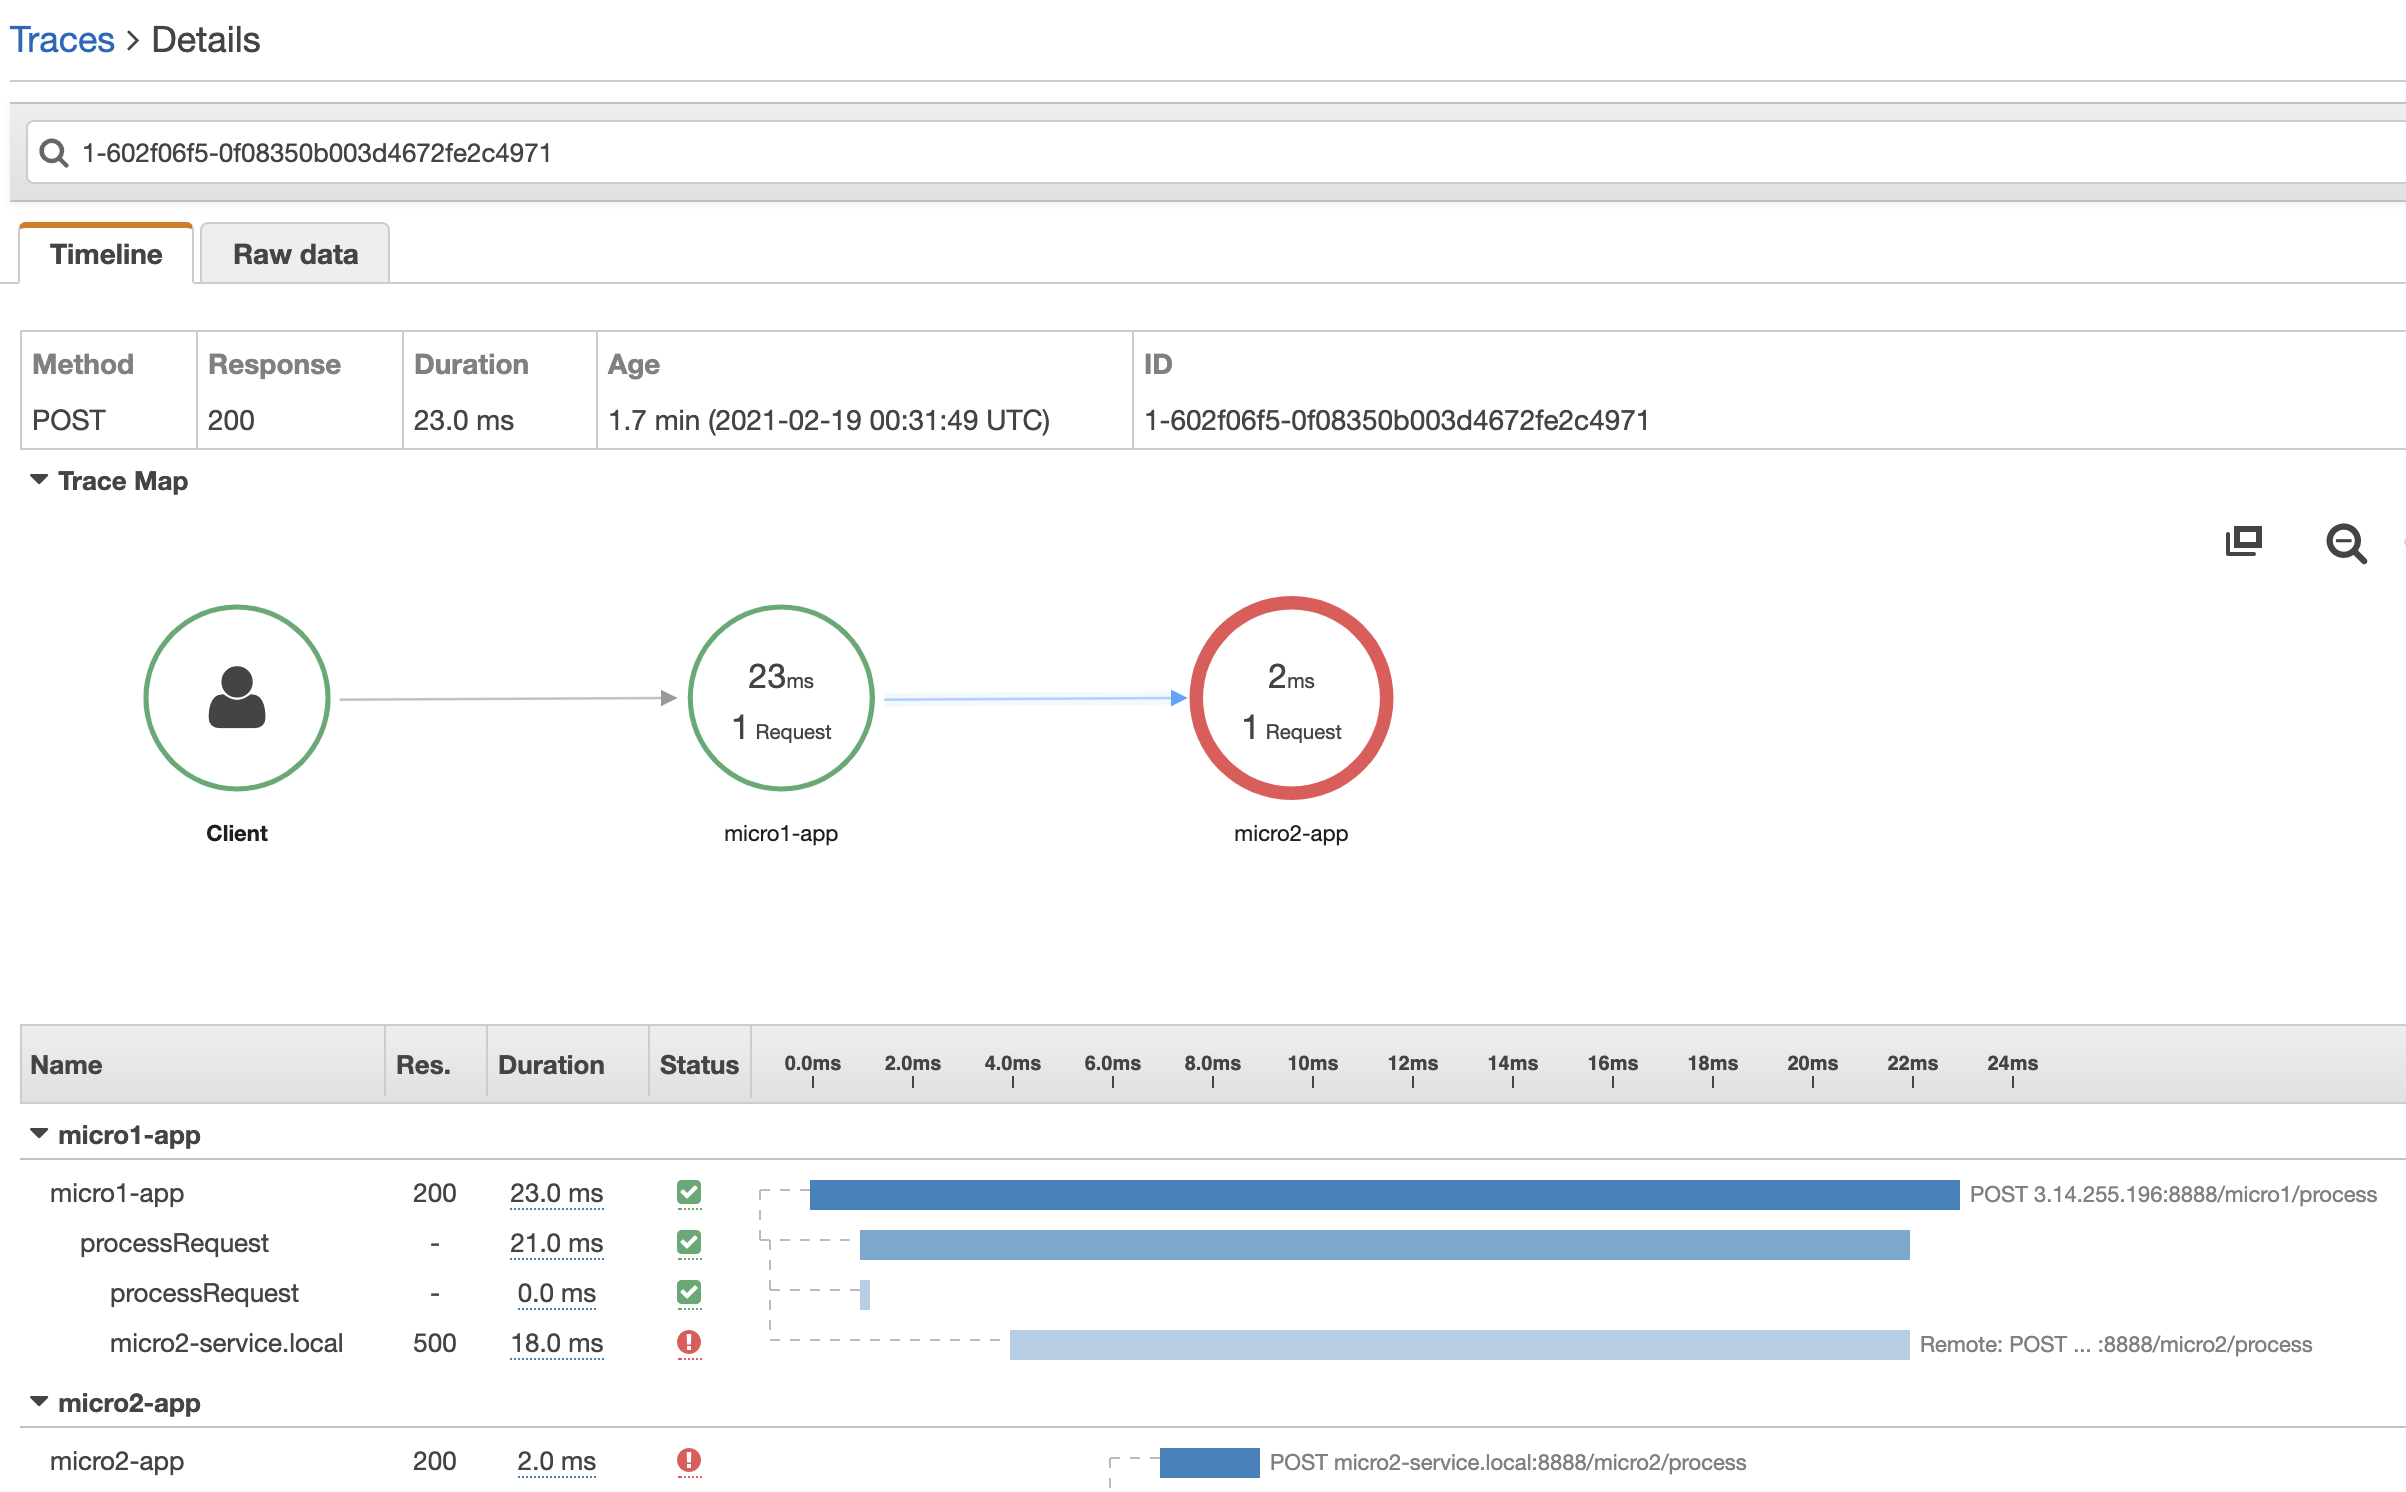
View and Analyse the tracing data on AWS X-Ray Console
X-Ray console uses trace data sent by the X-Ray daemon to generate a detailed service graph. The service graph can shows the client, front-end service, and backend services.
In this example we are tracing the client requests as they travel through the application which is comprised of 2 microservices:
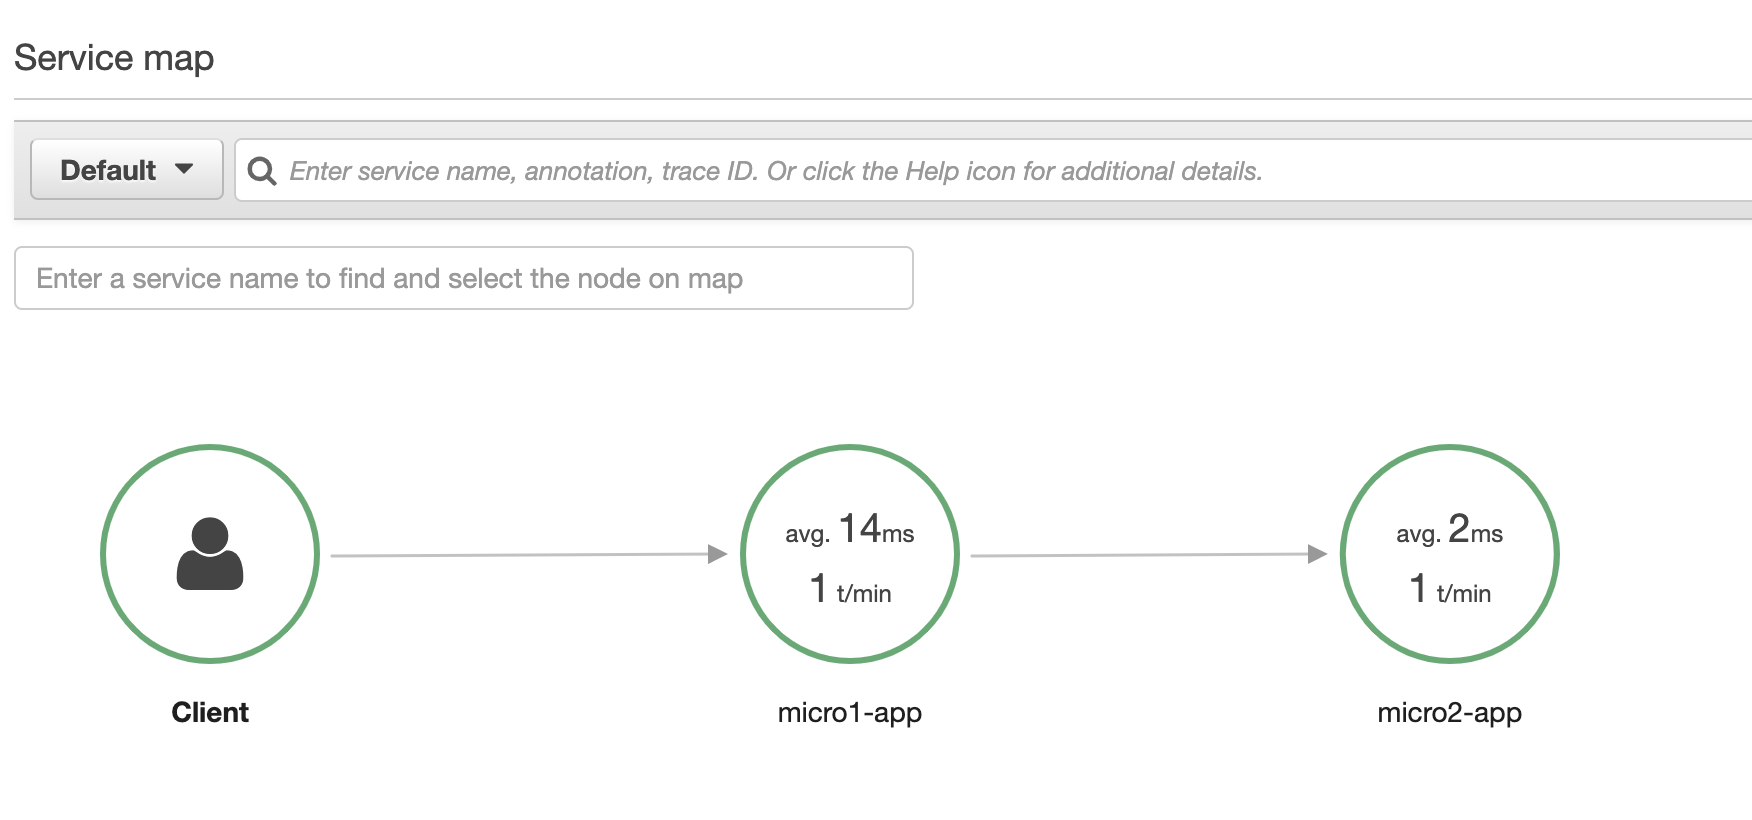
The console provides a filter expression language for filtering requests, and services based on data in request headers, response status, and indexed fields on the tracing data.
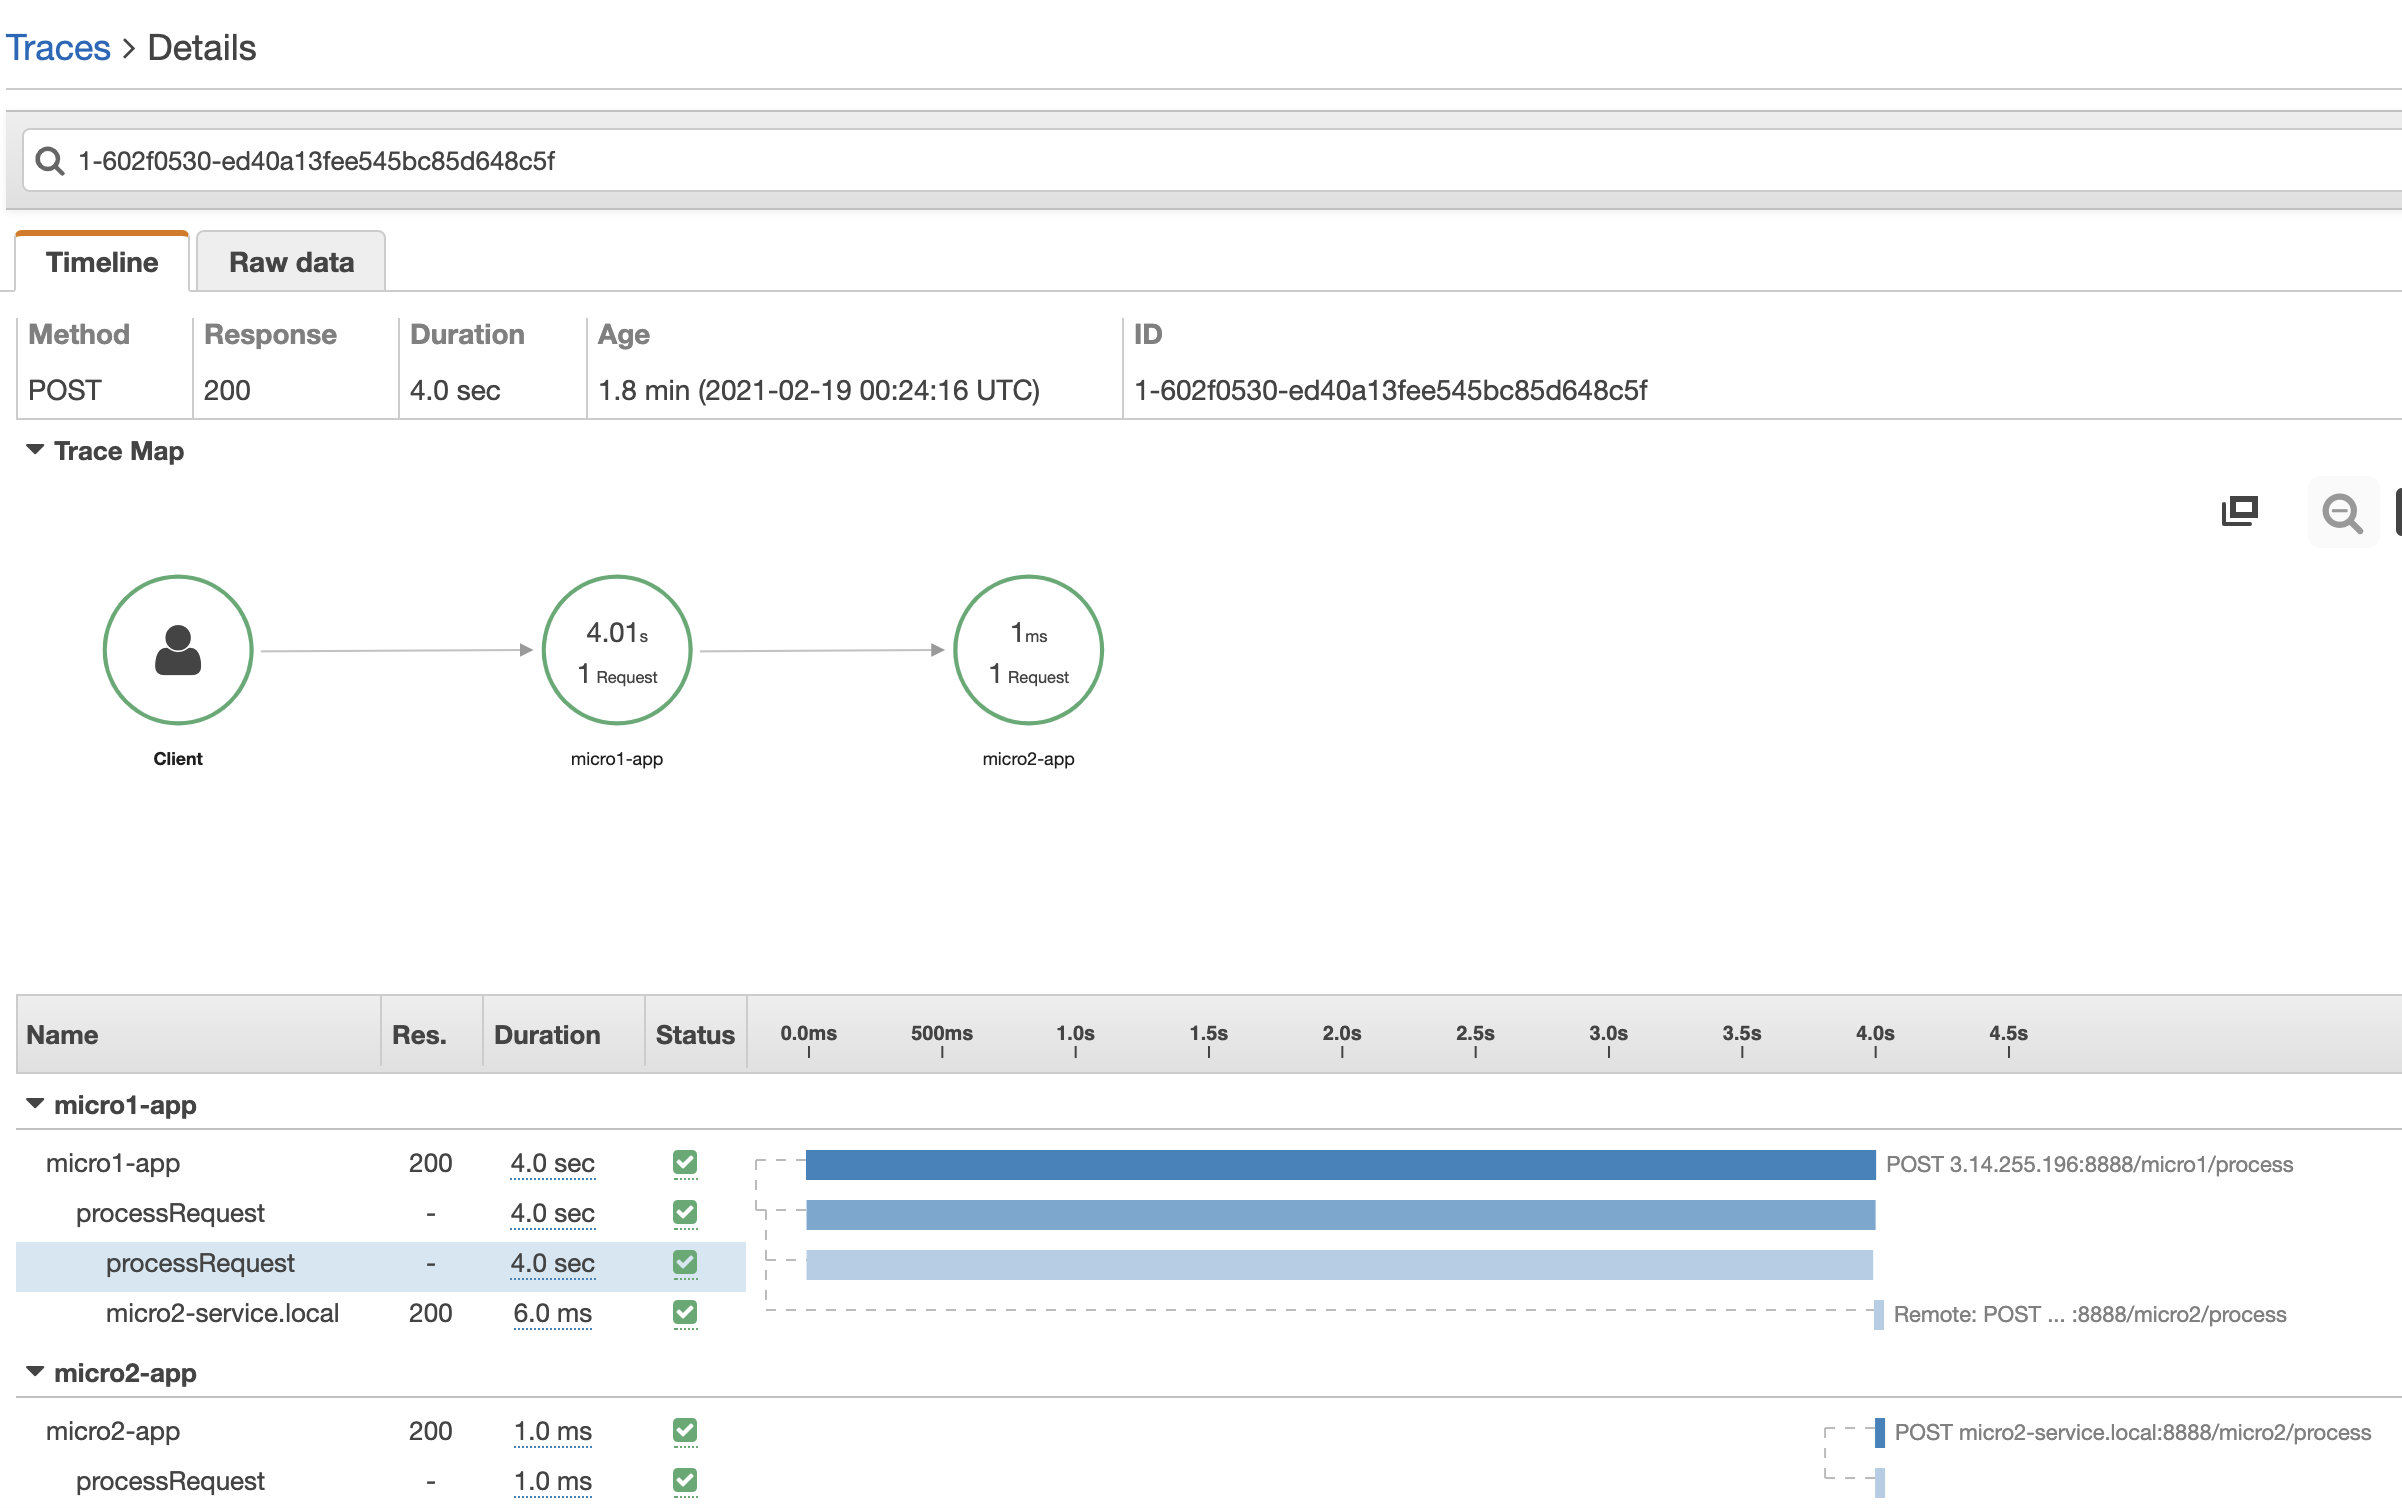
The service graph helps identify bottlenecks and latency spikes as shown in the example bellow where we introduced a latency on the first microservice:
It also identify services where errors are occurring:
Exception logs are also available:
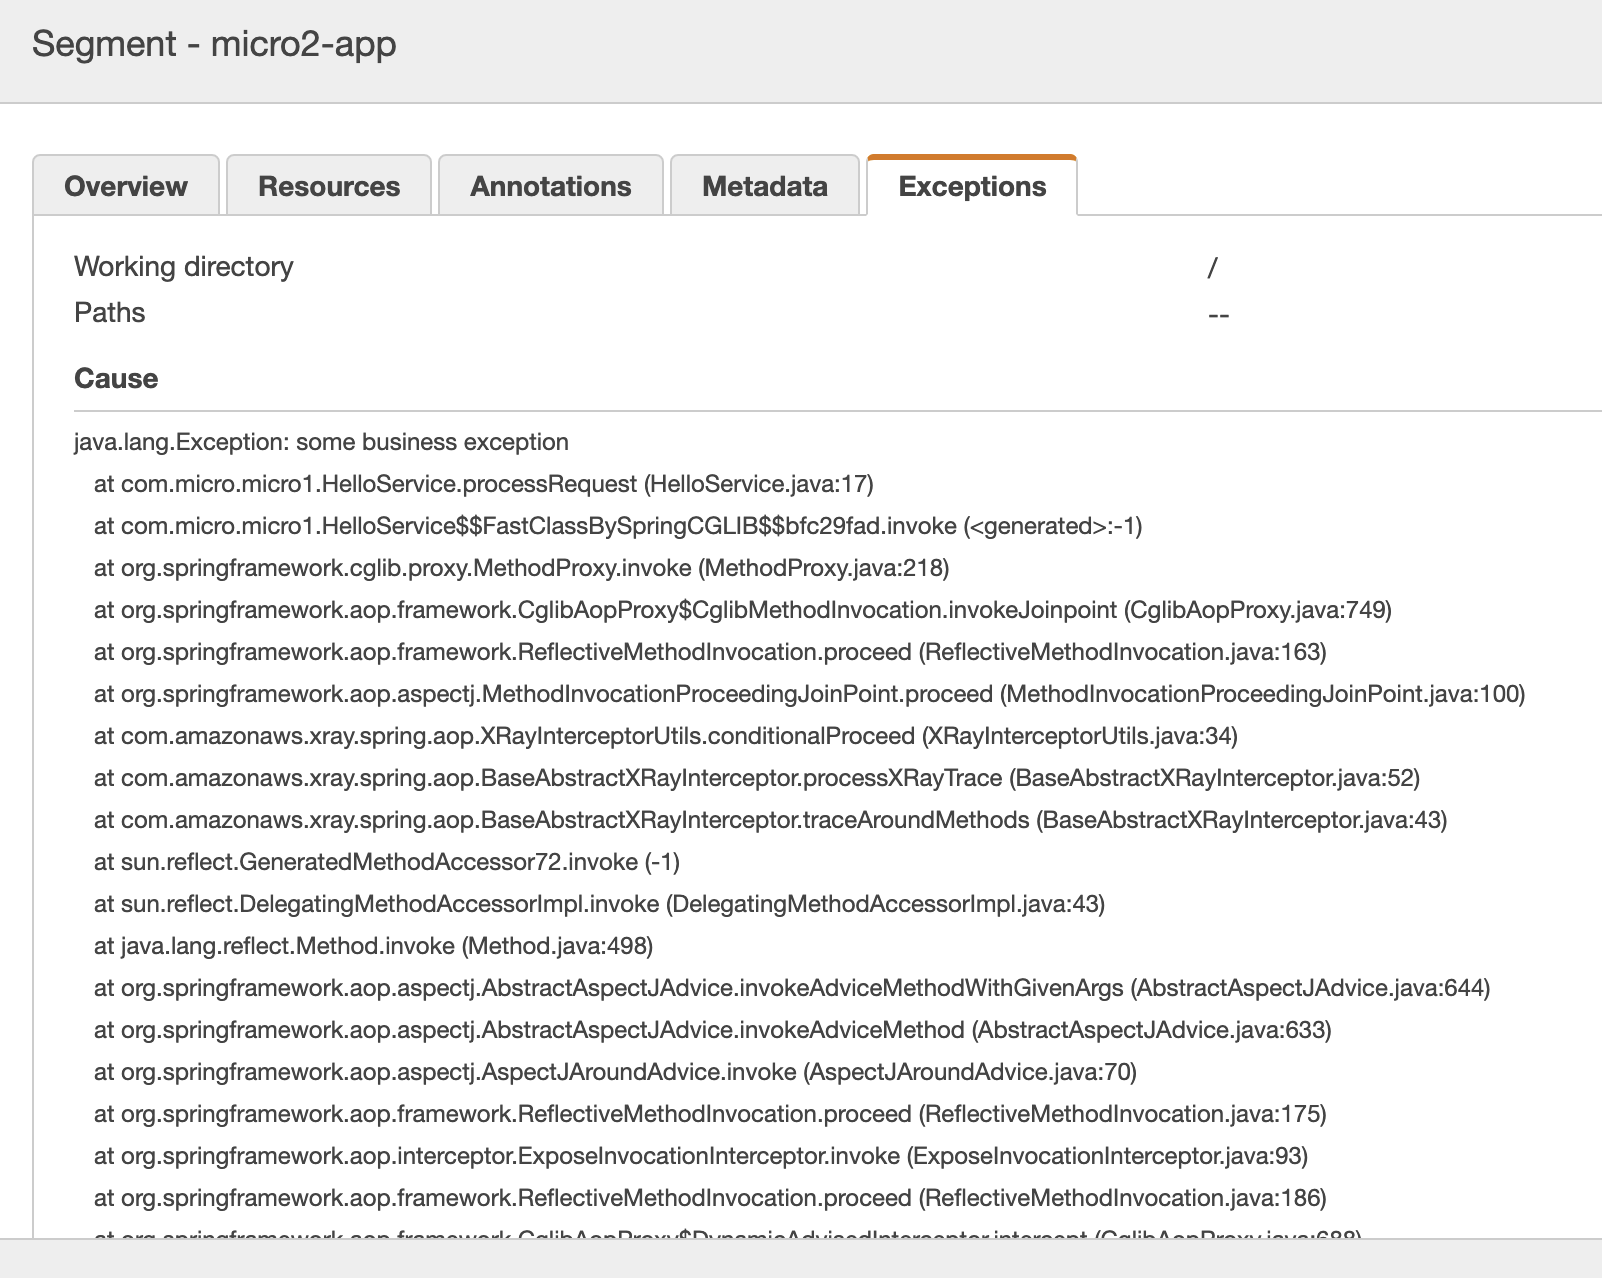
More details on the AWS X-Ray console can be found here
Conclusion
AWS X-Ray integrates natively with other AWS Services to increase the visibility of your architecture. The AWS X-Ray agent can also be run locally if some pieces of the application is deployed on-premises.
AWS X-Ray always encrypts traces at rest, and can also be configured to use AWS Key Management Service (AWS KMS) for compliance requirement like PCI and HIPAA.
Want to implement Distributed Tracing to monitor your architecture? Feel free to contact us. It would be a pleasure to help and work with you!


Comments