---
title: Monitoring a JHipster application with Datadog
description: "When you ship an application to production, one of the key factors of quality is\nthe monitoring capabilities of this application. In this post, we will see what\noptions are available for your JHipster [https://www.jhipster.tech/] \napplications, and we will dive down into using Datadog.\n\nObservability\nObservability is"
image: https://blog.ippon.tech/hubfs/Imported_Blog_Media/hipdog-3.png
---
[Skip to main content](https://blog.ippon.tech/monitoring-a-jhipster-app-with-datadog#main)
[   ](https://ipponusa.com/)
- [Home](https://ipponusa.com)
- [Show submenu for About About](https://ipponusa.com/about-us)
- [Who We Are](https://ipponusa.com/who-we-are)
- [Careers](https://ipponusa.com/careers)
- [Show submenu for Our Partners Our Partners](https://ipponusa.com/our-partners/)
- [AWS](https://ipponusa.com/our-partners/aws/)
- [Snowflake](https://ipponusa.com/our-partners/snowflake/)
- [Databricks](https://ipponusa.com/our-partners/databricks/)
- [Microsoft](https://ipponusa.com/our-partners/microsoft/)
- [Show submenu for Services Services](https://ipponusa.com/services)
- [Snowflake](https://ipponusa.com/service/snowflake-concierge/)
- [Artificial Intelligence](https://ipponusa.com/service/artificial-intelligence/)
- [Data & Analytics](https://ipponusa.com/service/data-analytics/)
- [Cloud Strategy](https://ipponusa.com/service/cloud-strategy/)
- [Platform Modernization](https://ipponusa.com/service/platform-moderization/)
- [Product Innovation](https://ipponusa.com/service/product-innovation/)
- [Operating Model](https://ipponusa.com/service/operating-model/)
- [Blogs](https://blog.ippon.tech/)
- [Success Stories](https://ipponusa.com/success-stories/)
- [Show submenu for Resources Resources](https://ipponusa.com/resources/)
- [eBooks](https://ipponusa.com/ebooks/)
- [The Data Pour](https://info.ippon.tech/the-data-pour)
- [Videos & Webinars](https://info.ippon.tech/videos-and-webinars)
- [Media Center](https://ipponusa.com/media-center/)
Search
Open main navigation
Close main navigation
- [Home](https://ipponusa.com)
- Show submenu for About About
- About
- [About](https://ipponusa.com/about-us)
- [Who We Are](https://ipponusa.com/who-we-are)
- [Careers](https://ipponusa.com/careers)
- Show submenu for Our Partners Our Partners
- Our Partners
- [Our Partners](https://ipponusa.com/our-partners/)
- [AWS](https://ipponusa.com/our-partners/aws/)
- [Snowflake](https://ipponusa.com/our-partners/snowflake/)
- [Databricks](https://ipponusa.com/our-partners/databricks/)
- [Microsoft](https://ipponusa.com/our-partners/microsoft/)
- Show submenu for Services Services
- Services
- [Services](https://ipponusa.com/services)
- [Snowflake](https://ipponusa.com/service/snowflake-concierge/)
- [Artificial Intelligence](https://ipponusa.com/service/artificial-intelligence/)
- [Data & Analytics](https://ipponusa.com/service/data-analytics/)
- [Cloud Strategy](https://ipponusa.com/service/cloud-strategy/)
- [Platform Modernization](https://ipponusa.com/service/platform-moderization/)
- [Product Innovation](https://ipponusa.com/service/product-innovation/)
- [Operating Model](https://ipponusa.com/service/operating-model/)
- [Blogs](https://blog.ippon.tech/)
- [Success Stories](https://ipponusa.com/success-stories/)
- Show submenu for Resources Resources
- Resources
- [Resources](https://ipponusa.com/resources/)
- [eBooks](https://ipponusa.com/ebooks/)
- [The Data Pour](https://info.ippon.tech/the-data-pour)
- [Videos & Webinars](https://info.ippon.tech/videos-and-webinars)
- [Media Center](https://ipponusa.com/media-center/)
- Search
- [Contact Us](https://ipponusa.com/contact/)
[Contact Us](https://ipponusa.com/contact/)
# Monitoring a JHipster application with Datadog

by [Alexis Seigneurin](https://blog.ippon.tech/author/alexis-seigneurin)
March 16, 2018

[JHipster](https://blog.ippon.tech/tag/jhipster/)
Mar 16, 2018
When you ship an application to production, one of the key factors of quality is the monitoring capabilities of this application. In this post, we will see what options are available for your [JHipster](https://www.jhipster.tech/?ref=blog.ippon.tech) applications, and we will dive down into using Datadog.
# Observability
Observability is the ability to understand what an application is doing, and how well it is performing.
We usually talk about *the 3 ways of observability*:
- metrics: numbers that are reported, such as the memory used by the application, the number of calls to an API endpoint...
- logging: the events that happened
- tracing: the measure of how much time each component took to perform an action.
I recommend watching Adrien Cole's talk:
We will see in this post if we can achieve these 3 principles of observability with a JHipster application.
# Basic monitoring with JHipster
Out of the box, JHipster provides you with a page to display the metrics of your application.
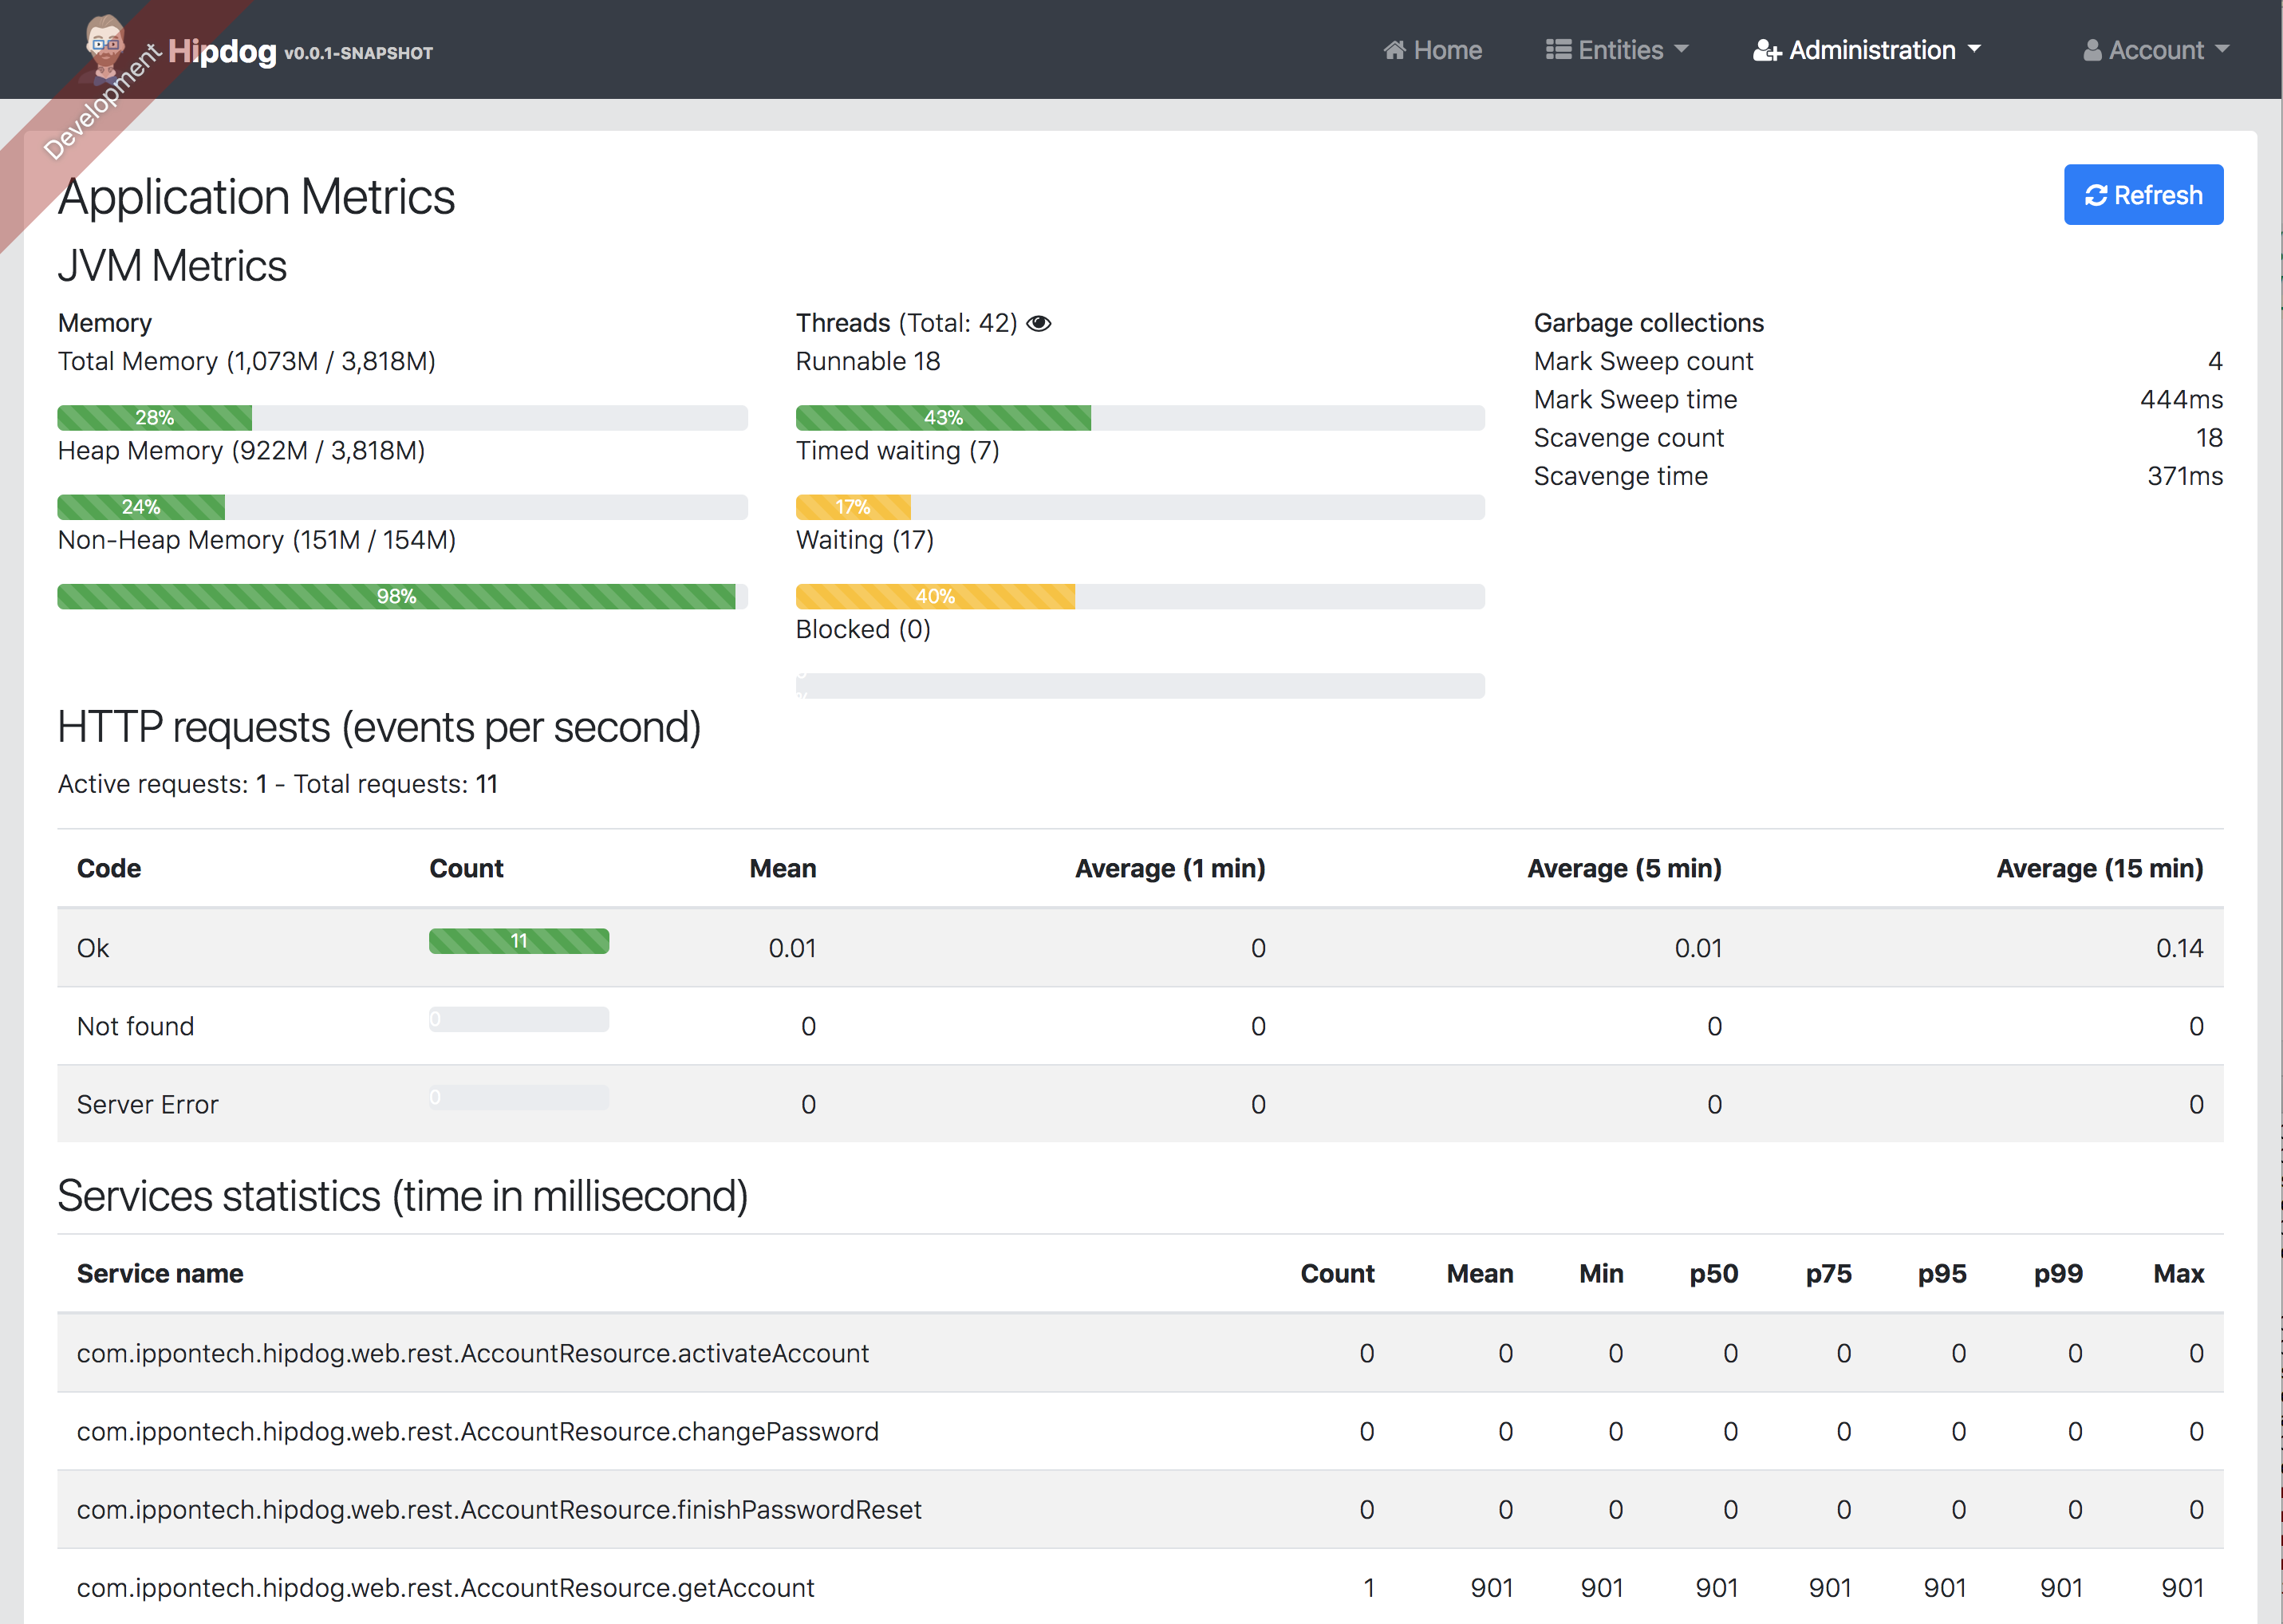
We also get the logs of our application on the console, and we can redirect them to a file by changing the configuration. Log levels can also be adusted on the file to get more or less details.
This is a great start, but we're missing 3 things:
- tracing: you would need to use other products for this
- history of the metrics: you only get a live view of the metrics
- centralized and aggregated storage: if your app is distributed (multiple instances or multiple microservices), finding important imformation will be difficult.
# JHipster Console & Zipkin
JHipster offers a console as a separate product. It provides a dashboard to visualize your metrics. Since JHipster Console is based on Elasticsearch and Kibana, logs and metrics are archived and searchable.
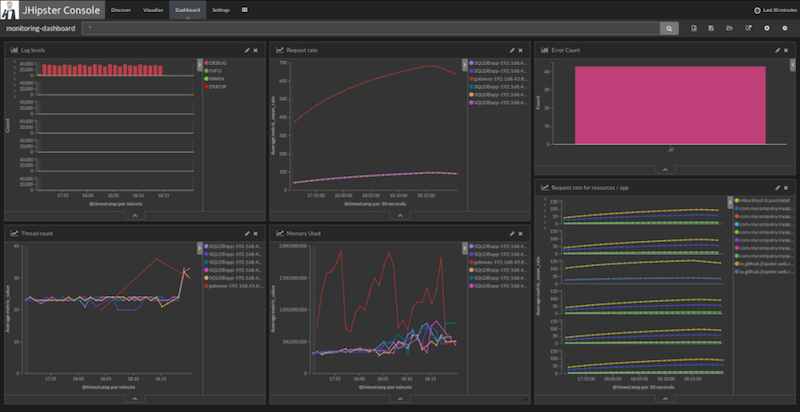
Integration with Zipkin is also possible to get distributed tracing of your application.
See [JHipster's monitoring documentation page](https://www.jhipster.tech/monitoring/?ref=blog.ippon.tech) for more information.
# Integration with Datadog
Now, if you already use Datadog, you probably want to send your metrics/logs/tracing to this service. If you don't know [Datadog](https://www.datadoghq.com/?ref=blog.ippon.tech), it is a monitoring solution *as a service*. They provide an agent to install on your machine/server/EC2 instance, and the agent will ship metrics and logs to Datadog's servers. They then offer a UI to dig into your data.
I am not going to go through the features provided by Datadog, but instead show how to configure your JHipster application to send its monitoring information.
## Reporting metrics
Let's start with the metrics. A JHipster application uses [Dropwizard Metrics](http://metrics.dropwizard.io/4.0.0/?ref=blog.ippon.tech) to collect and ship metrics to another system. In this case, we want to ship the metrics to Datadog. Let's start by adding [Metrics Datadog Reporter](https://github.com/coursera/metrics-datadog?ref=blog.ippon.tech) to our build.
I'm using Gradle, so I'm adding this line to my `build.gradle` file:
```
compile 'org.coursera:dropwizard-metrics-datadog:1.1.13'
```
If you are using Maven, you would add this to your `pom.xml`:
```
org.coursera
dropwizard-metrics-datadog
1.1.13
```
Now, we're going to modify the `MetricsConfiguration` class. You can add the following code as the end of the `init()` method:
```
EnumSet expansions = EnumSet.of(COUNT, RATE_1_MINUTE, RATE_15_MINUTE, MEDIAN, P95, P99);
HttpTransport httpTransport = new HttpTransport.Builder()
.withApiKey(apiKey)
.build();
DatadogReporter reporter = DatadogReporter.forRegistry(metricRegistry)
.withHost(InetAddress.getLocalHost().getHostName())
.withTransport(httpTransport)
.withExpansions(expansions)
.build();
reporter.start(10, TimeUnit.SECONDS);
```
You will then need to [retrieve](https://app.datadoghq.com/account/settings?ref=blog.ippon.tech#api) your *API key*. Once you have that key, you will most likely want to put it the `application.yml` file and inject its value as a property of the `MetricsConfiguration` bean.
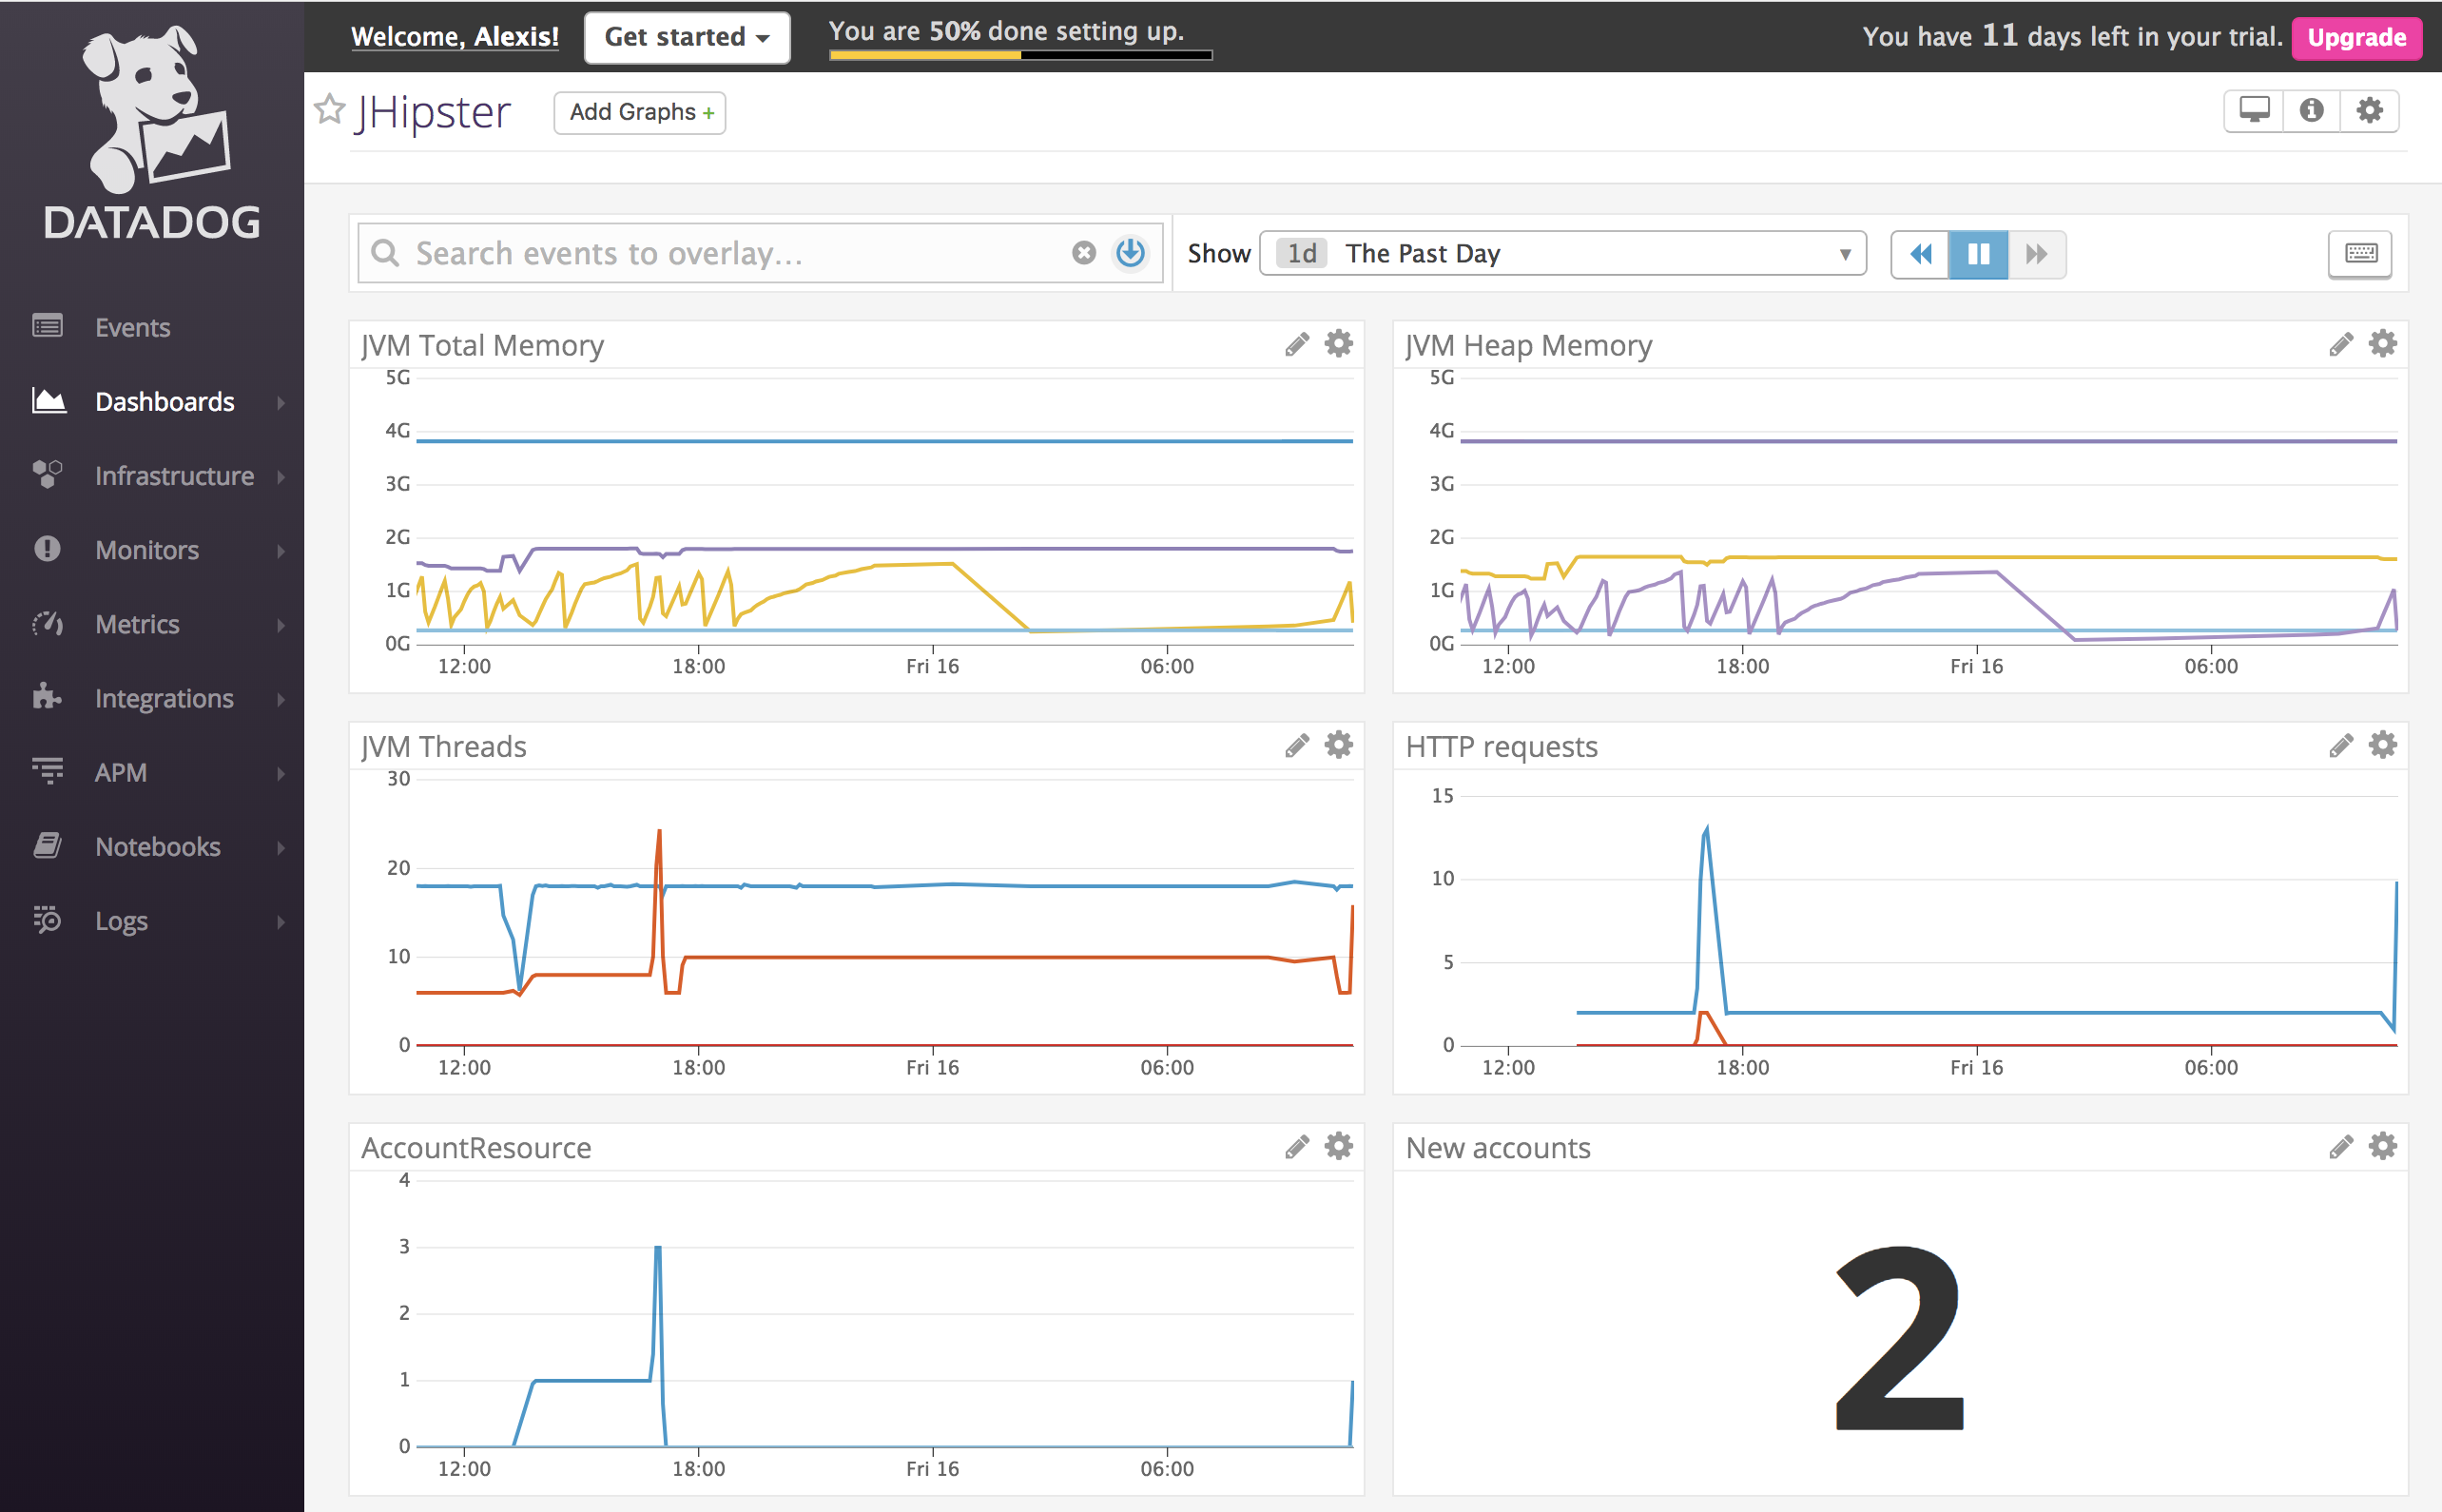
Once this is done, the application will send its metrics to Datadog every 10 seconds. You can then visualize them on Datadog, and create dashboards:
## Reporting logs
The next step is to send our logs to Datadog. Datadog recently acquired Logmatic, and the product is now integrated in the service.
There are [2 ways](https://docs.datadoghq.com/logs/?ref=blog.ippon.tech) to send your logs to Datadog:
- have your application write its logs to a file, and use Datadog's agent to read from this file
- have the agent listen for TCP or UDP connections, and have your app send its logs straight to the agent.
We're going to use files. It is - in my opinion - easier to inspect and debug.
We first need to configure JHipster to log to files. Open the `logback.xml` file and add the following configuration:
```
logs/logFile.%d{yyyy-MM-dd}.log
90
utf-8
%d %-5level [%thread] %logger{0}: %msg%n
```
Logs will still be written to the console, but also written to files in the `logs` directory.
Now, let's configure the Datadog agent to collect the logs. Start by enabling the log collection feature in the `datadog.yaml` file:
```
logs_enabled: true
```
We then need to create a configuration file for Datadog's agent. My application is called "HipDog", so I am creating a file called `conf.yaml` in a `hipdog.d` folder (`/opt/datadog-agent/etc/conf.d/hipdog.d/conf.yaml`), with the following content:
```
logs:
- type: file
path: /Users/aseigneurin/dev/jhipster-datadog/logs/*.log
service: hipdog
source: jhipster
log_processing_rules:
- type: multi_line
name: new_log_start_with_date
pattern: \d{4}\-(0?[1-9]|1[012])\-(0?[1-9]|[12][0-9]|3[01])
```
Now, if you restart the Datadog agent and wait a few seconds, your logs should start appearing in the UI:
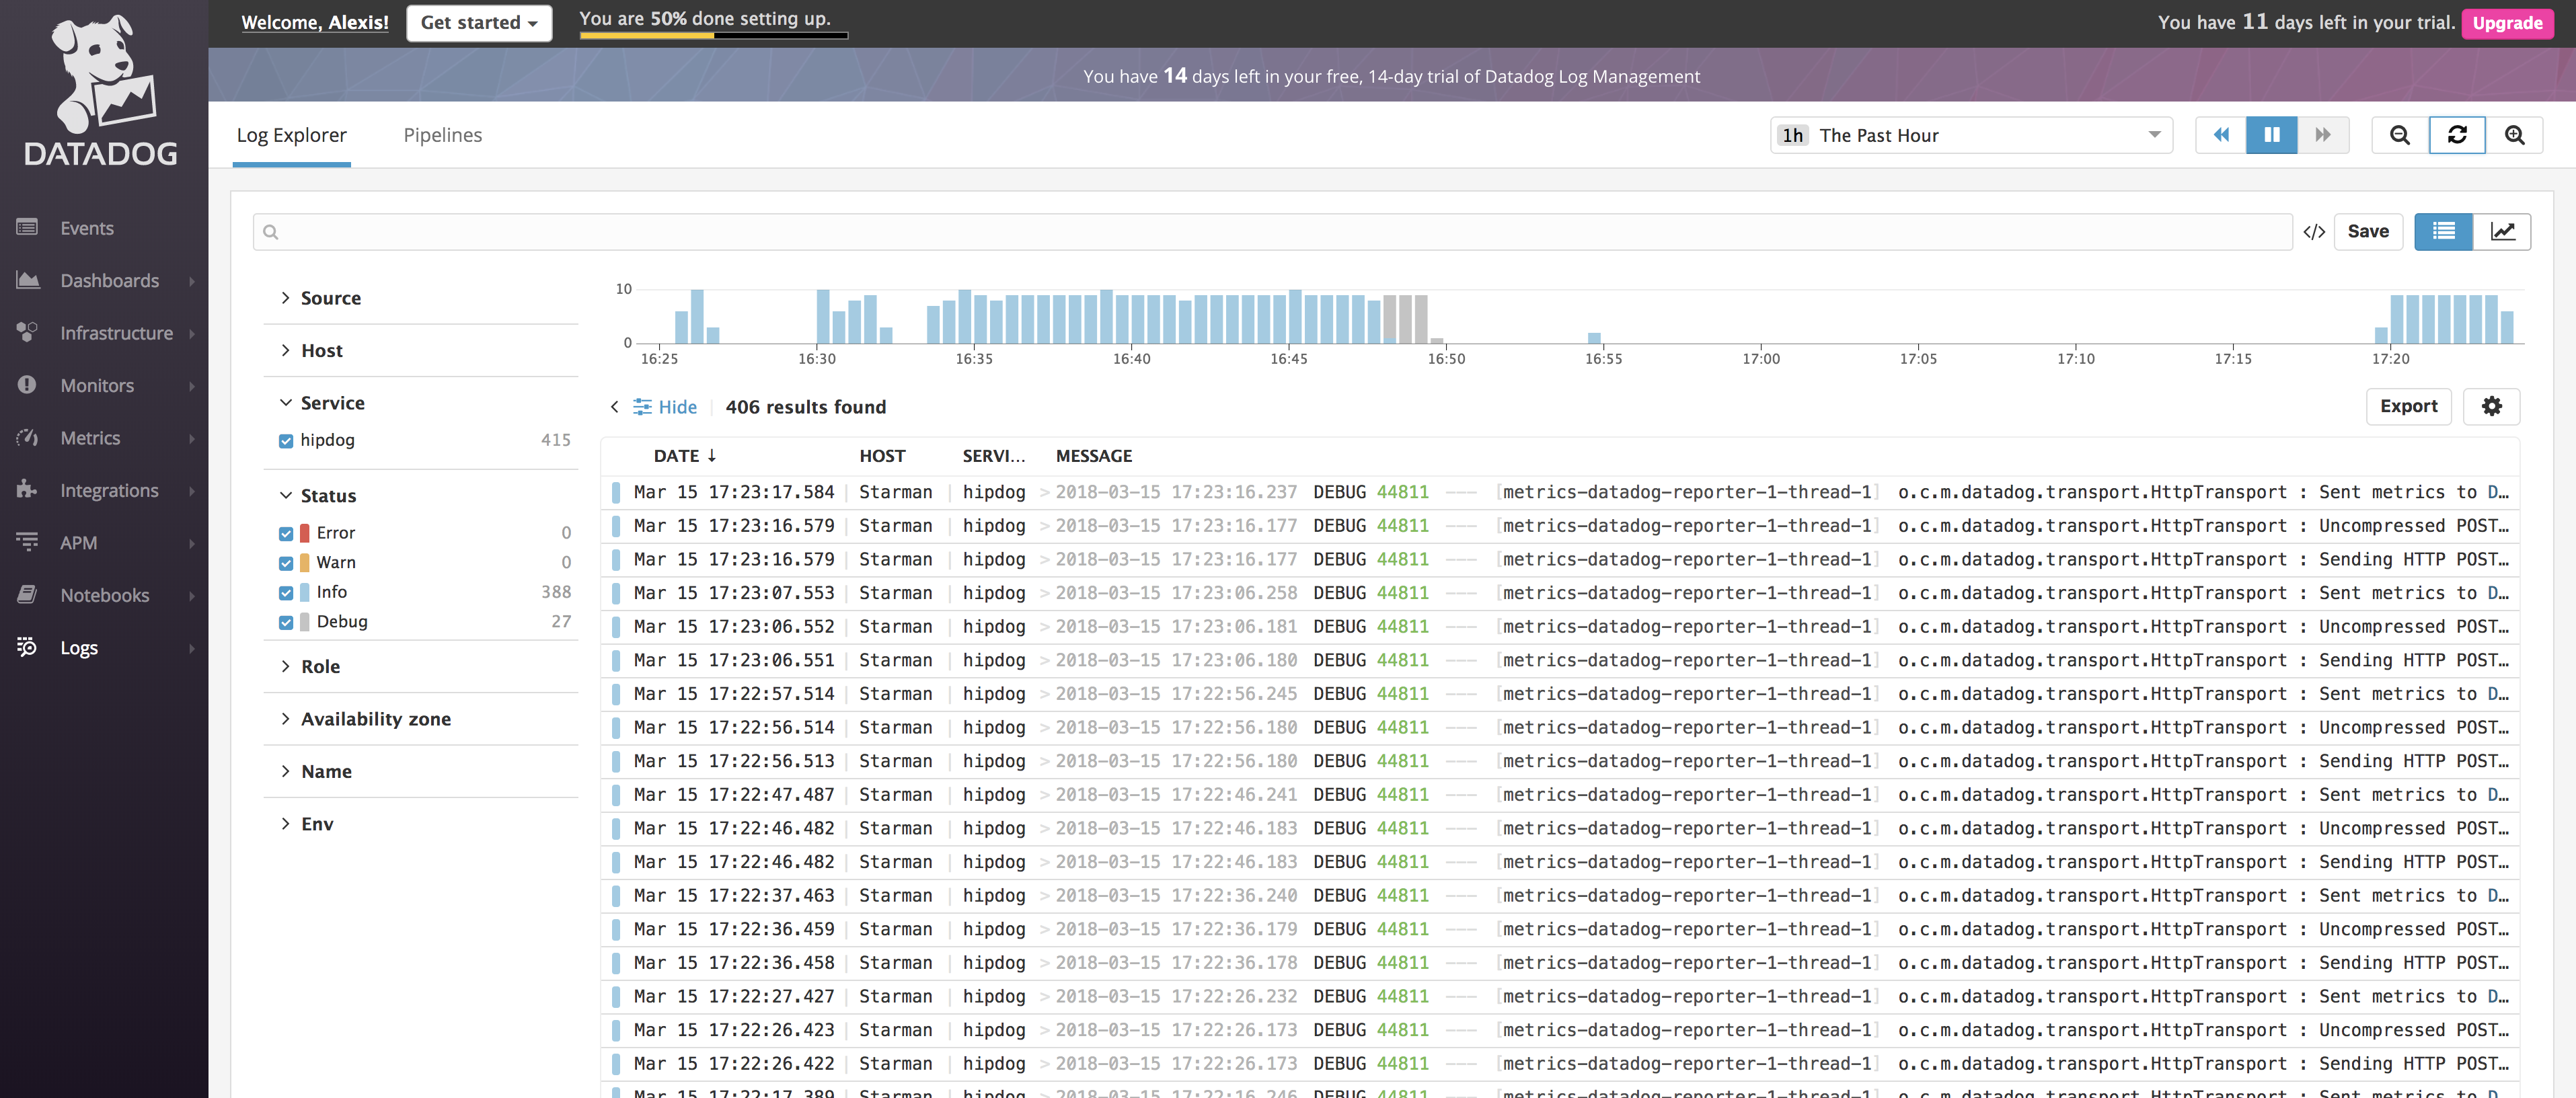
Notice that, at this point, we've only *shipped* the logs. They're not parsed yet, meaning the timestamps may be a little off (they correspond to when the agent read the lines), and the level will always be `INFO`.
What we need is to define a "Pipeline". You would define a *Grok parser*:
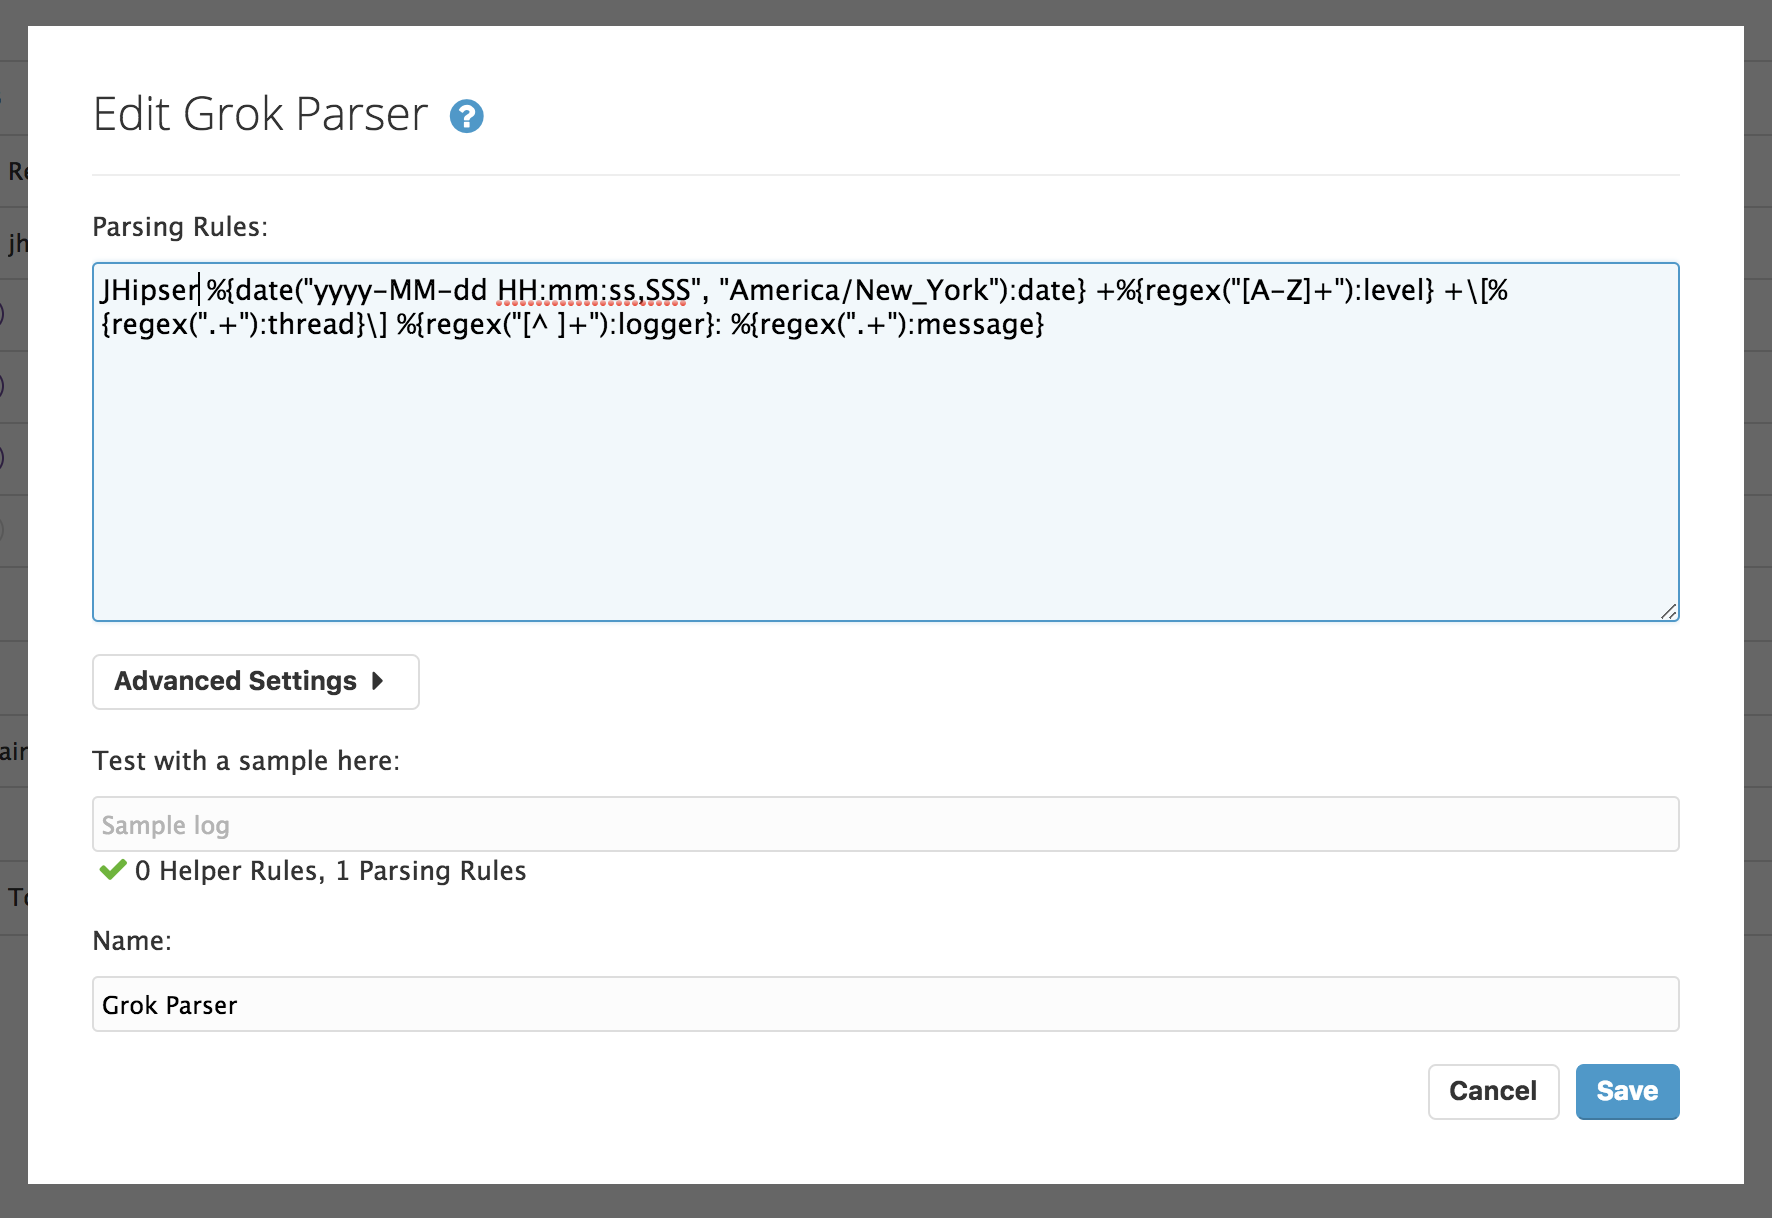
The configuration I used is:
```
JHipsterRule %{date("yyyy-MM-dd HH:mm:ss,SSS", "America/New_York"):date} +%{regex("[A-Z]+"):level} +\[%{regex(".+"):thread}\] %{regex("[^ ]+"):logger}: %{regex(".+"):message}
```
Make sure you specify the correct time zone (or, better, configure Logback to output logs with a timezone indication), otherwise your timestamps will be shifted by a few hours and be rejected by Datadog (the ingestion process will not consider logs that are more than 5 hours old or 2 hours in the future).
We then need to add 2 other components to our Pipeline:
- a *Log Status Remapper*, to remap the level we found in the log lines to the level attribute
- a *Log Date Remapper*, to use the timestamp we parsed rather than the agent's timestamps.
Once done, you should be able to see extra attributes in your logs:
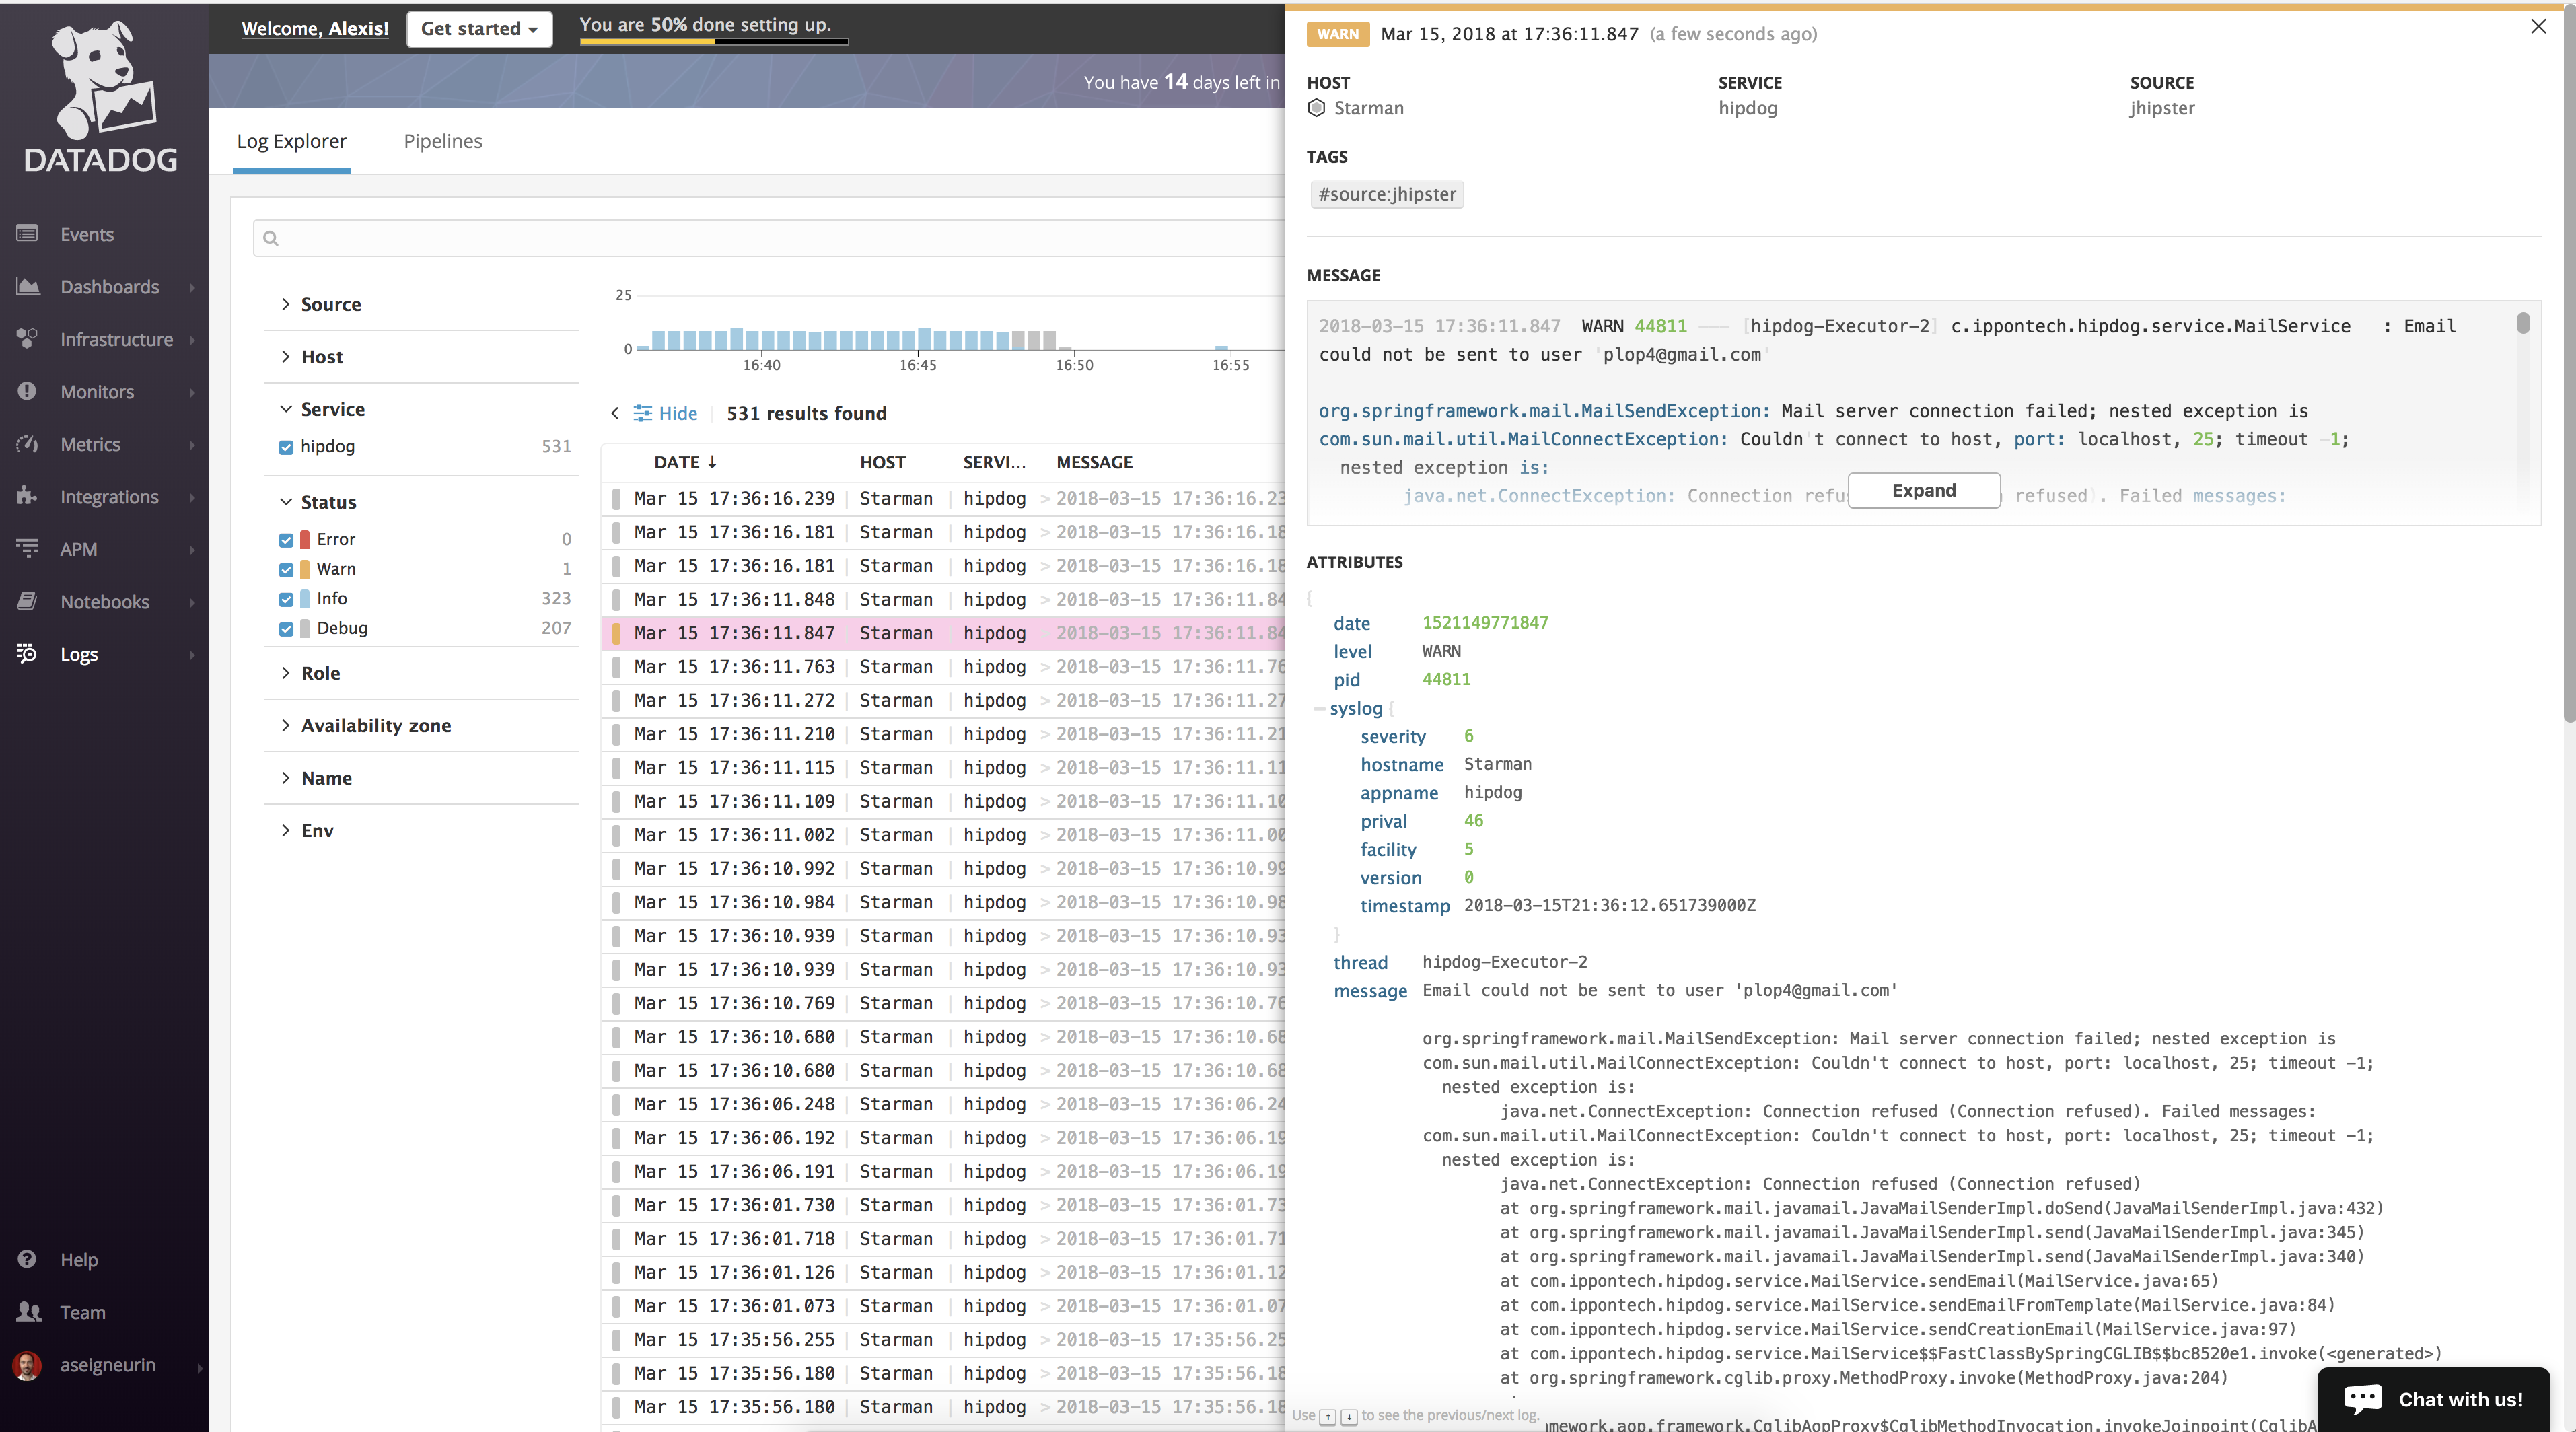
You will also be able to search / drill down into your logs.
## Reporting tracing information
Datadog has a feature called [APM](https://docs.datadoghq.com/tracing/?ref=blog.ippon.tech) to collect and analyze traces from your application. For the JVM, you need to [download a JVM agent](https://docs.datadoghq.com/tracing/setup/?ref=blog.ippon.tech) and enable it:
```
-javaagent:dd-java-agent.jar -Ddd.service.name=hipdog
```
Traces would then be sent from the JVM agent to the Datadog agent, and then to Datadog, allowing you to analyze the traces online:
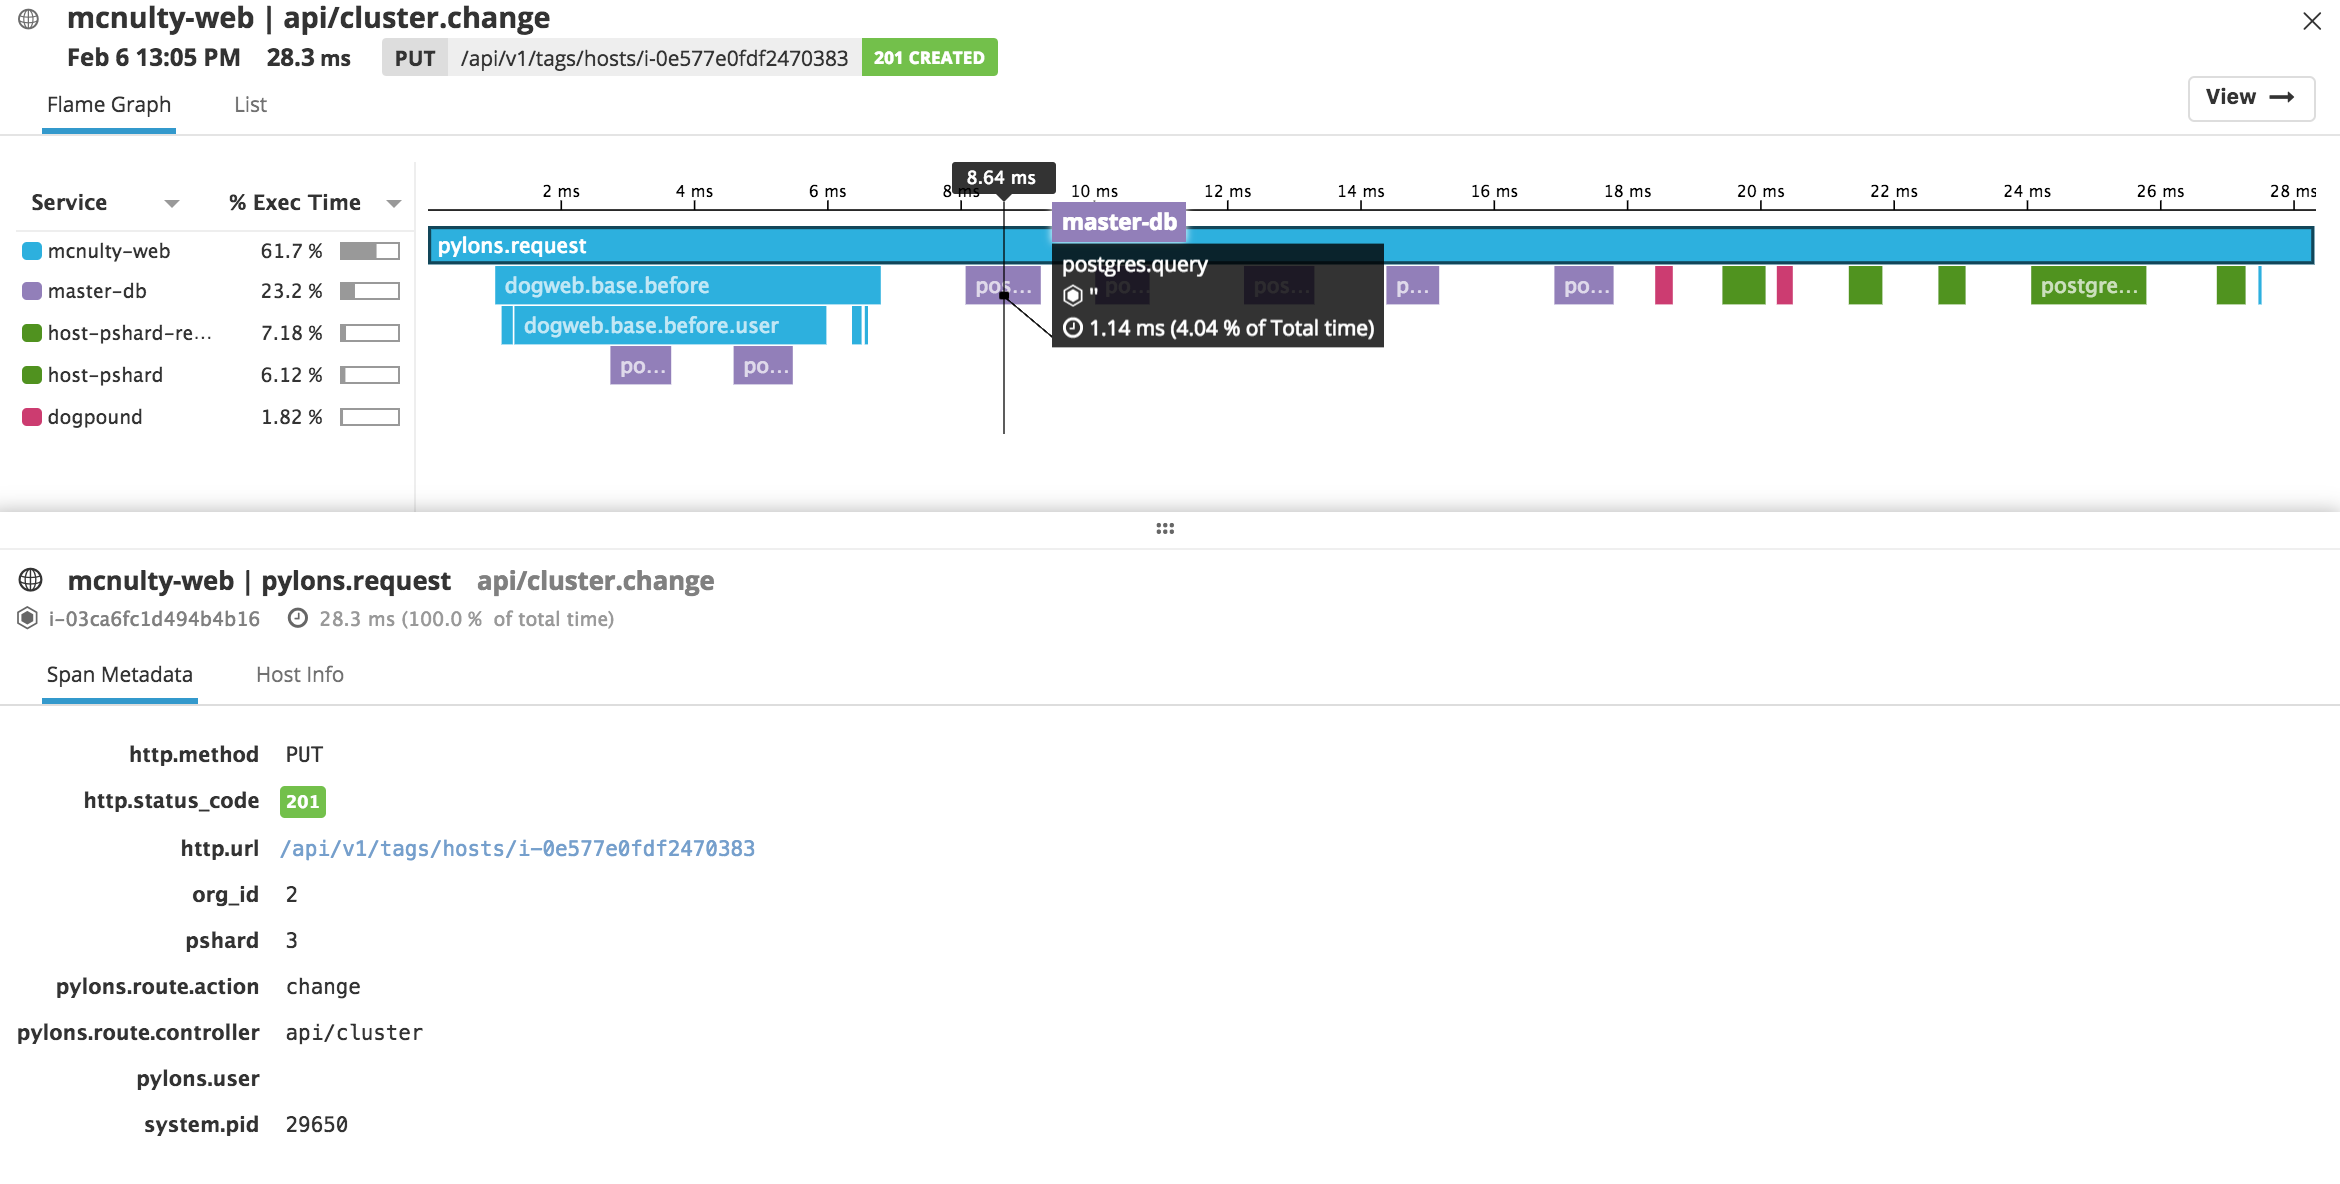
Unfortunately, so far, I haven't been able to get this to work. I will update this post as soon as I have found the issue.
# Conclusion
If we ignore the fact that I wasn't able to enable the APM functionality, Datadog allows us to achieve the 3 ways of Observability for our JHipster application. This is very easy to configure and provides a very easy-to-use UI. If we had had microservices, we would even had been able to provide an aggregated view of the health of our platform!
The main drawback is that we cannot provide a default configuration for Datadog's UI that would suit any JHipster application. It would be nice to be able to provide a dashboard, as well as a pipeline configuration, to import into Datadog. We may be able to provide an [integration](https://docs.datadoghq.com/integrations/?ref=blog.ippon.tech) and get it accepted by Datadog...
## Related Articles
##### [ JHipster Lite • December 16, 2022 How to Create a Quick React and Angular App with JHipster Lite 8 min read](https://blog.ippon.tech/how-to-create-a-quick-react-and-angular-app-with-jhipster-lite)
##### [ JHipster • March 11, 2021 JHipster Registry with ECS 3 min read](https://blog.ippon.tech/jhipster-registry-with-ecs)
##### [ Spring • January 29, 2021 Comparing Quarkus to Spring Through the Eyes of JHipster 2 min read](https://blog.ippon.tech/comparing-quarkus-to-spring-through-the-eyes-of-jhipster)
### Comments
### Subscribe to Our Blog!
Stay informed with the latest insights and updates by signing up for our weekly blog newsletter – delivered straight to your inbox!
[Back to blog homepage »](https://blog.ippon.tech/)

Ippon is a consulting and expertise firm, who is convinced that technology is a source of progress for society. We help our clients leverage their digital assets to design an appropriate strategy and deploy their transformation roadmap at scale.
#### Navigation
- [Home](https://ipponusa.com/)
- [About](https://ipponusa.com/about-us/)
- [Services](https://ipponusa.com/services/)
- [Blogs](https://blog.ippon.tech/?__hstc=223043268.1036d82247623b329dfefe4e92697801.1714729179243.1714729179243.1714729179243.1&__hssc=223043268.2.1714729179244&__hsfp=803678701)
- [eBooks](https://ipponusa.com/ebooks/)
- [The Data Pour](https://info.ippon.tech/the-data-pour?__hstc=223043268.1036d82247623b329dfefe4e92697801.1714729179243.1714729179243.1714729179243.1&__hssc=223043268.2.1714729179244&__hsfp=803678701)
[Contact Us](https://ipponusa.com/contact/)
[Join Us](https://ipponusa.com/careers/)
#### Services
- [Data & Analytics](https://ipponusa.com/service/data-analytics/)
- [Cloud Strategy](https://ipponusa.com/service/cloud-strategy/)
- [Artificial Intelligence](https://ipponusa.com/service/artificial-intelligence/)
- [Operating Model](https://ipponusa.com/service/operating-model/)
- [Platform Modernization](https://ipponusa.com/service/platform-moderization/)
- [Product Innovation](https://ipponusa.com/service/product-innovation/)
#### Ippon International
- [France](https://fr.ippon.tech/?__hstc=223043268.1036d82247623b329dfefe4e92697801.1714729179243.1714729179243.1714729179243.1&__hssc=223043268.2.1714729179244&__hsfp=803678701)
- [Australia](https://au.ippon.tech/?__hstc=223043268.1036d82247623b329dfefe4e92697801.1714729179243.1714729179243.1714729179243.1&__hssc=223043268.2.1714729179244&__hsfp=803678701)
- #### Contact
- Ippon Technologies
[3431 West Leigh Street Richmond, VA 23230, USA](https://maps.app.goo.gl/RySm6SAwZnsxeiLz9)
- [(844) 477- 6687](tel:8444776687)
- [Sales@ipponusa.com](mailto:Sales@ipponusa.com)
©Copyright 2024 Ippon USA. All Rights Reserved. | [Terms and Conditions](https://ipponusa.com/privacy-policy/) | [Privacy Policy](https://ipponusa.com/privacy-policy/) | [Website by Skol Marketing](https://skolmarketing.com/)
```json
{
"@context" : "https://schema.org",
"@type" : "BlogPosting",
"author" : {
"@type" : "Person",
"name" : "Alexis Seigneurin",
"url" : "https://blog.ippon.tech/author/alexis-seigneurin"
},
"dateModified" : "2024-01-29T17:52:23.563Z",
"datePublished" : "2018-03-16T14:50:00.000Z",
"headline" : "Monitoring a JHipster application with Datadog",
"image" : [ "https://blog.ippon.tech/hubfs/Imported_Blog_Media/hipdog-3.png" ],
"mainEntityOfPage" : {
"@id" : "https://blog.ippon.tech/monitoring-a-jhipster-app-with-datadog",
"@type" : "WebPage"
},
"publisher" : {
"@type" : "Organization",
"logo" : {
"@type" : "ImageObject",
"url" : "https://blog.ippon.tech/hubfs/logo_SVG.svg"
},
"name" : "Ippon Technologies"
}
}
```