


To do so, we built an application using Streamlit, the ChatGPT API and Snowflake. Let's dig into some enhancements we can make to our existing app to further increase the usability and value for any non-technical stakeholders. We're also going to examine some interesting things We're jumping right into it, so if this is the first time you're embarking on this journey with us, please check out my prior blog here. Remember to activate your virtual environment before running your application!
Summarizing Results
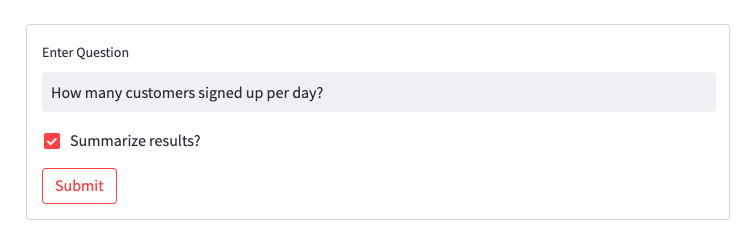
It'd be nice if a tabular view of our data was all our stakeholders ever wanted from their reports. Sadly, a tabular view is rarely enough. So let's get ChatGPT to do the hard work for us and summarize our data. To do so, I added a checkbox to our Streamlit Form.
with st.form(key="my_form"):
  text_input = st.text_input(label="Enter Question")
  summarize_check = st.checkbox("Summarize results?")
  submit_button = st.form_submit_button(label="Submit")
I then added an if-statement after we displayed our tabular data.
if summarize_check:
time.sleep(30)
summarize_message = [
{
"role": "user",
"content": f"Given this data:{df}, give me a summary of the data. Do not include the question in your response.",
}
]
summary_completion = openai.ChatCompletion.create(
model="gpt-3.5-turbo", messages=summarize_message
)
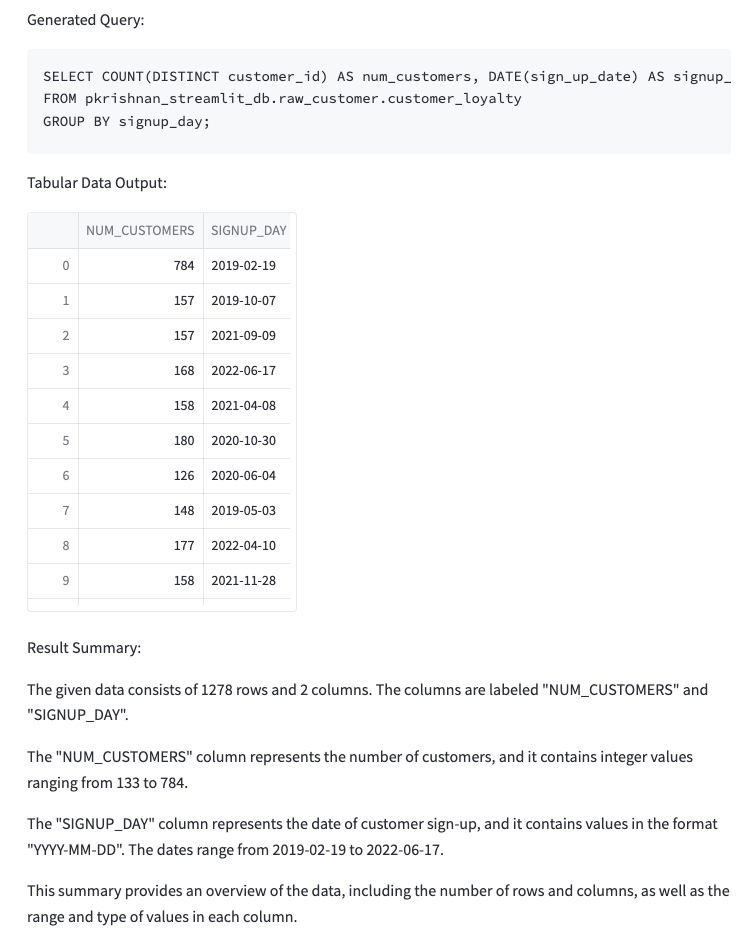
st.write(f"Result Summary: ")
st.write(summary_completion.choices[0].message.content)
As context, I provided our returned dataframe from Snowflake, and asked ChatGPT to give me a summary of the data. Like we did when we had ChatGPT return the query, I also asked ChatGPT to not include the question in its response. We can test this out now. Hopefully you're seeing something like what I have below.
Graphing our Results
The final thing a stakeholder could want from our application is a graph of the results. This was the most difficult part for me to implement because all of the fancy plugins ChatGPT has to graph results are only available on the Paid Tier and I believe are not available via the API. So I had to get a little hack-y and creative to graph our results.
The first thing I did was have ChatGPT tell me which chart would be the best to graph our data.
graph_message = [
    {
        "role": "user",
        "content": f"Given this data:{df}, give me one chart type to display the data. Do not include the question in your response. Give me only the chart type",
    }
]

graph_completion = openai.ChatCompletion.create(
    model="gpt-3.5-turbo", messages=graph_message
)

chart_type = graph_completion.choices[0].message.content
st.write(f"Graphing Data Result as a {chart_type}")
For our question, How many customers signed up per day? I noticed that ChatGPT returned either Line Chart or Bar Chart. So I chose to implement these two paths as if-blocks in our Python code. Additionally, since I'm using Streamlit's line_chart and bar_chart functions, it was important especially for the line_chart to additionally identify which columns belong on the X-Axis and which belong on the Y-Axis. This is what I came up with so I could leverage ChatGPT to tell me which columns are perfect for the X and Y Axes.
if "line chart" in chart_type.lower():
  ### get x and y columns for the chart from ChatGPT
  xlm = [
      {
          "role": "user",
          "content": f"Given this data:{df}, give me the X Columns for a line chart. Do not include the question in your response. Give me only the X Axis Column Names.",
      }
  ]

  xlm_completion = openai.ChatCompletion.create(
      model="gpt-3.5-turbo", messages=xlm
  )

  result = xlm_completion.choices[0].message.content.strip()

  x_axis_col_list = []
  for col in list(df):
      if col in result:
          x_axis_col_list.append(col)

  x_axis = x_axis_col_list[0]

  ylm = [
      {
          "role": "user",
          "content": f"Given this data:{df}, give me the Y Columns for a line chart. Do not include the question in your response. Give me only the Y Axis Column Names.",
      }
  ]

  ylm_completion = openai.ChatCompletion.create(
      model="gpt-3.5-turbo", messages=ylm
  )

  result = ylm_completion.choices[0].message.content.strip()

  y_axis_col_list = []
  for col in list(df):
      if col in result:
          y_axis_col_list.append(col)

  st.line_chart(data=df, x=x_axis, y=y_axis_col_list)
and
if "bar chart" in chart_type.lower():
  xlm = [
      {
          "role": "user",
          "content": f"Given this data:{df}, give me the X Columns for a bar chart. Do not include the question in your response. Give me only the X Axis Column Names.",
      }
  ]

  xlm_completion = openai.ChatCompletion.create(
      model="gpt-3.5-turbo", messages=xlm
  )

  result = xlm_completion.choices[0].message.content.strip()

  x_axis_col_list = []
  for col in list(df):
      if col in result:
          x_axis_col_list.append(col)

  x_axis = x_axis_col_list[0]

  ylm = [
      {
          "role": "user",
          "content": f"Given this data:{df}, give me the Y Columns for a bar chart. Do not include the question in your response. Give me only the Y Axis Column Names.",
      }
  ]

  ylm_completion = openai.ChatCompletion.create(
      model="gpt-3.5-turbo", messages=ylm
  )

  result = ylm_completion.choices[0].message.content.strip()

  y_axis_col_list = []
  for col in list(df):
      if col in result:
          y_axis_col_list.append(col)

  st.bar_chart(
      data=df,
      x=x_axis,
      y=y_axis_col_list,
  )
Here is the graphed data as a bar chart: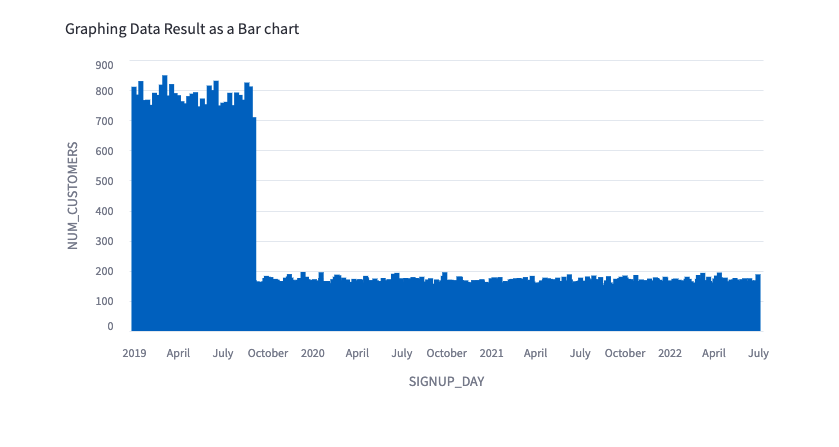
This is a really quick-and-dirty way to leverage ChatGPT to graph your data. I'm sure there are better ways, but this approach showcases the power of ChatGPT even for rudimentary data analysis.
Our Final Code
Here is the final code file for the streamlit application that we built today.
import streamlit as st
import snowflake.connector
import openai
import yaml
import time
import os

with open("gpt_sql/config/table_config.yml", "r") as file:
    db_config = yaml.safe_load(file)

with st.form(key="my_form"):
    text_input = st.text_input(label="Enter Question")
    summarize_check = st.checkbox("Summarize results?")
    graph_check = st.checkbox("Graph results?")
    submit_button = st.form_submit_button(label="Submit")

if submit_button:
    con = snowflake.connector.connect(
        user=os.getenv("SNOWFLAKE_USER"),
        password=os.getenv("SNOWFLAKE_PASSWORD"),
        account=os.getenv("SNOWFLAKE_ACCOUNT"),
        role="SYSADMIN",
        warehouse="PK_DEV_WH",
        session_parameters={
            "QUERY_TAG": "pk_dev_streamlit_test",
        },
    )
    ### How many customers signed up per day?
    openai.api_key = os.getenv("OPEN_API_KEY")
    generate_query_message = [
        {
            "role": "user",
            "content": f"Given this database config:{db_config}, give me the SQL query for this question: {text_input} with the table_name in database.schema.table_name format. Do not include the question in your response. Do not provide explanations.",
        }
    ]
    query_completion = openai.ChatCompletion.create(
        model="gpt-3.5-turbo", messages=generate_query_message, temperature=0.2
    )

    query = query_completion.choices[0].message.content
    st.write("Generated Query: ")
    st.code(body=query, language="SQL")

    cursor = con.cursor()
    cursor.execute(query)
    df = cursor.fetch_pandas_all()

    st.write("Tabular Data Output: ")
    st.dataframe(df)

    if summarize_check:
        time.sleep(30)

        summarize_message = [
            {
                "role": "user",
                "content": f"Given this data:{df}, give me a summary of the data. Do not include the question in your response.",
            }
        ]

        summary_completion = openai.ChatCompletion.create(
            model="gpt-3.5-turbo", messages=summarize_message, temperature=0.5
        )

        st.write(f"Result Summary: ")
        st.write(summary_completion.choices[0].message.content)

    if graph_check:
        time.sleep(30)

        graph_message = [
            {
                "role": "user",
                "content": f"Given this data:{df}, give me one chart type to display the data. Do not include the question in your response. Give me only the chart type",
            }
        ]

        graph_completion = openai.ChatCompletion.create(
            model="gpt-3.5-turbo", messages=graph_message, temperature=0.2
        )

        chart_type = graph_completion.choices[0].message.content
        st.write(f"Graphing Data Result as a {chart_type}")

        if "line chart" in chart_type.lower():
            ### get x and y columns for the chart from CahtGPT
            time.sleep(5)
            xlm = [
                {
                    "role": "user",
                    "content": f"Given this data:{df}, give me the X Columns for a line chart. Do not include the question in your response. Give me only the X Axis Column Names.",
                }
            ]

            xlm_completion = openai.ChatCompletion.create(
                model="gpt-3.5-turbo", messages=xlm
            )

            result = xlm_completion.choices[0].message.content.strip()

            x_axis_col_list = []
            for col in list(df):
                if col in result:
                    x_axis_col_list.append(col)

            x_axis = x_axis_col_list[0]

            time.sleep(5)
            ylm = [
                {
                    "role": "user",
                    "content": f"Given this data:{df}, give me the Y Columns for a line chart. Do not include the question in your response. Give me only the Y Axis Column Names.",
                }
            ]

            ylm_completion = openai.ChatCompletion.create(
                model="gpt-3.5-turbo", messages=ylm
            )

            result = ylm_completion.choices[0].message.content.strip()

            y_axis_col_list = []
            for col in list(df):
                if col in result:
                    y_axis_col_list.append(col)

            st.line_chart(data=df, x=x_axis, y=y_axis_col_list)

        if "bar chart" in chart_type.lower():
            time.sleep(5)
            xlm = [
                {
                    "role": "user",
                    "content": f"Given this data:{df}, give me the X Columns for a bar chart. Do not include the question in your response. Give me only the X Axis Column Names.",
                }
            ]

            xlm_completion = openai.ChatCompletion.create(
                model="gpt-3.5-turbo", messages=xlm
            )

            result = xlm_completion.choices[0].message.content.strip()

            x_axis_col_list = []
            for col in list(df):
                if col in result:
                    x_axis_col_list.append(col)

            x_axis = x_axis_col_list[0]

            time.sleep(5)
            ylm = [
                {
                    "role": "user",
                    "content": f"Given this data:{df}, give me the Y Columns for a bar chart. Do not include the question in your response. Give me only the Y Axis Column Names.",
                }
            ]

            ylm_completion = openai.ChatCompletion.create(
                model="gpt-3.5-turbo", messages=ylm
            )

            result = ylm_completion.choices[0].message.content.strip()

            y_axis_col_list = []
            for col in list(df):
                if col in result:
                    y_axis_col_list.append(col)

            st.bar_chart(
                data=df,
                x=x_axis,
                y=y_axis_col_list,
            )
Lessons Learned with ChatGPT
Finally, I wanted to share with you all some of the lessons I learned while working with ChatGPT to create this small application.
Phrasing Matters
The real estate phrase "Location, Location, Location" can be quite easily converted to ChatGPT to be "Phrasing, Phrasing, Phrasing". Because of the model, ChatGPT often interprets the same phrase or question, in our case, to different results. I've seen two variations of a query returned:
SELECT COUNT(DISTINCT customer_id) AS num_customers, DATE(sign_up_date) AS signup_day
FROM pkrishnan_streamlit_db.raw_customer.customer_loyalty
GROUP BY signup_day;
SELECT COUNT(DISTINCT customer_id) AS num_customers FROM pkrishnan_streamlit_db.raw_customer.customer_loyalty
GROUP BY signup_day;
Obviously only one of these queries is ideal if we are to gather meaningful insights about the data displayed.
Model Result Temperature
This is where I had to experiment with setting different values for the temperature. ChatGPT actually provides a secondary method for narrowing the sampling range called top_p. With top_p, the model considers the results of the tokens with top_p probability mass. So 0.1 means only the tokens comprising the top 10% probability mass are considered. ChatGPT suggests using only top_p or temperature when working with models. It may be worth experimenting between the two as you're foraying into using the ChatGPT API more.
Code Generation vs. Graph Generation
Earlier, I alluded to having problems when generating the graph for our application. That is in part due to the lack of plugins and integrations with the ChatGPT API. I tried to use the ChatGPT API to generate the HTML Code for the graph itself. But no matter what phrasing I tried, I wasn't getting clean HTML code back. Additionally, even if you provide ChatGPT the entire dataset like I did, it still only returns back a sample HTML file complete with comments asking you to manually add in all of the X-points and Y-points. I'd be curious to see how the graph generation changes if you are on a paid ChatGPT subscription and using one of the plugins.
Timeouts
As you all are sure to have noticed, I have periodic time.sleep() function calls interspersed throughout the final Streamlit application. This is because I'm using ChatGPT's free tier which is limited to 3 API calls per minute.
Cost of ChatGPT
While building and running this application, I used about 20 cents of the $5.00 credit I was given. ChatGPT prices per token. For the model I'm using, ChatGPT charged me $0.0015 per 1K tokens for Inputs and $0.002 per 1K tokens for Outputs. This cost is fairly cheap for a small-scale application like the one we built. But it would be worth keeping an eye on for a large-scale application with multiple calls to ChatGPT with a large context.
Conclusion
Thanks so much for taking the time to follow along in this quick exercise. As I mentioned in the beginning, this is one potential approach for integrating Generative AI with dashboards to democratize your data for less technical stakeholders. As we've seen, ChatGPT is a powerful technology which can be used in a variety of ways. This application is just one of many ways it can be used in the data and analytics space. But we've also seen some of it's stumbling blocks and lessons learned while working with it. I hope you've learned something and had some fun experimenting with a technology that is brimming with potential.
For more information on how Ippon Technologies can help your organization utilize Snowflake or Streamlit for all of your data needs, contact sales@ipponusa.com.


Comments