---
title: NYC subway data with Kafka Streams and JHipster (part 2 of 2)
description: "In part 1\n[https://blog.ippon.tech/nyc-subway-data-with-kafka-streams-and-jhipster-part-1/] of this\nblog post I explained how to retrieve data from the MTA feed and publish it to\nKafka. I will now explain how to easily visualize this data using InfluxDB\n[https://www.influxdata.com/] and Grafana [https://grafana.com/]. InfluxDB is"
image: https://blog.ippon.tech/hubfs/Imported_Blog_Media/mta-kafka-logo-Jan-18-2024-06-08-34-5696-PM.png
---
[Skip to main content](https://blog.ippon.tech/nyc-subway-data-with-kafka-streams-and-jhipster-part-2#main)
[   ](https://ipponusa.com/)
- [Home](https://ipponusa.com)
- [Show submenu for About About](https://ipponusa.com/about-us)
- [Who We Are](https://ipponusa.com/who-we-are)
- [Careers](https://ipponusa.com/careers)
- [Show submenu for Our Partners Our Partners](https://ipponusa.com/our-partners/)
- [AWS](https://ipponusa.com/our-partners/aws/)
- [Snowflake](https://ipponusa.com/our-partners/snowflake/)
- [Databricks](https://ipponusa.com/our-partners/databricks/)
- [Microsoft](https://ipponusa.com/our-partners/microsoft/)
- [Show submenu for Services Services](https://ipponusa.com/services)
- [Snowflake](https://ipponusa.com/service/snowflake-concierge/)
- [Artificial Intelligence](https://ipponusa.com/service/artificial-intelligence/)
- [Data & Analytics](https://ipponusa.com/service/data-analytics/)
- [Cloud Strategy](https://ipponusa.com/service/cloud-strategy/)
- [Platform Modernization](https://ipponusa.com/service/platform-moderization/)
- [Product Innovation](https://ipponusa.com/service/product-innovation/)
- [Operating Model](https://ipponusa.com/service/operating-model/)
- [Blogs](https://blog.ippon.tech/)
- [Success Stories](https://ipponusa.com/success-stories/)
- [Show submenu for Resources Resources](https://ipponusa.com/resources/)
- [eBooks](https://ipponusa.com/ebooks/)
- [The Data Pour](https://info.ippon.tech/the-data-pour)
- [Videos & Webinars](https://info.ippon.tech/videos-and-webinars)
- [Media Center](https://ipponusa.com/media-center/)
Search
Open main navigation
Close main navigation
- [Home](https://ipponusa.com)
- Show submenu for About About
- About
- [About](https://ipponusa.com/about-us)
- [Who We Are](https://ipponusa.com/who-we-are)
- [Careers](https://ipponusa.com/careers)
- Show submenu for Our Partners Our Partners
- Our Partners
- [Our Partners](https://ipponusa.com/our-partners/)
- [AWS](https://ipponusa.com/our-partners/aws/)
- [Snowflake](https://ipponusa.com/our-partners/snowflake/)
- [Databricks](https://ipponusa.com/our-partners/databricks/)
- [Microsoft](https://ipponusa.com/our-partners/microsoft/)
- Show submenu for Services Services
- Services
- [Services](https://ipponusa.com/services)
- [Snowflake](https://ipponusa.com/service/snowflake-concierge/)
- [Artificial Intelligence](https://ipponusa.com/service/artificial-intelligence/)
- [Data & Analytics](https://ipponusa.com/service/data-analytics/)
- [Cloud Strategy](https://ipponusa.com/service/cloud-strategy/)
- [Platform Modernization](https://ipponusa.com/service/platform-moderization/)
- [Product Innovation](https://ipponusa.com/service/product-innovation/)
- [Operating Model](https://ipponusa.com/service/operating-model/)
- [Blogs](https://blog.ippon.tech/)
- [Success Stories](https://ipponusa.com/success-stories/)
- Show submenu for Resources Resources
- Resources
- [Resources](https://ipponusa.com/resources/)
- [eBooks](https://ipponusa.com/ebooks/)
- [The Data Pour](https://info.ippon.tech/the-data-pour)
- [Videos & Webinars](https://info.ippon.tech/videos-and-webinars)
- [Media Center](https://ipponusa.com/media-center/)
- Search
- [Contact Us](https://ipponusa.com/contact/)
[Contact Us](https://ipponusa.com/contact/)
# NYC subway data with Kafka Streams and JHipster (part 2 of 2)

by [Theo LEBRUN](https://blog.ippon.tech/author/theo-lebrun)
November 7, 2018

[Apache Kafka](https://blog.ippon.tech/tag/apache-kafka/) [JHipster](https://blog.ippon.tech/tag/jhipster/)
*Published November 2018*
In [part 1](https://blog.ippon.tech/nyc-subway-data-with-kafka-streams-and-jhipster-part-1/) of this blog post I explained how to retrieve data from the MTA feed and publish it to Kafka. I will now explain how to easily visualize this data using [InfluxDB](https://www.influxdata.com/?ref=blog.ippon.tech) and [Grafana](https://grafana.com/?ref=blog.ippon.tech). InfluxDB is an open-source time series database that can be used as a data source for Grafana. Grafana is an open-source, general purpose dashboard and graph composer, which runs as a web application. Grafana will be used to visualize the number of active subways for each line through a day and see how this number changes with time.
All the code of this blog post can be found on this [GitHub repository](https://github.com/Falydoor/mta-kafka?ref=blog.ippon.tech) and I recommend cloning it instead of copying the code examples.
# Saving measurements to InfluxDB
## InfluxDB setup with the microservice
Starting an InfluxDB instance can be achieved using the below Docker command:
`docker run -p 8086:8086 -v $PWD:/var/lib/influxdb influxdb`
A database is required to save the measurements, here is the cURL command to create a database named `mta`:
`curl -G http://localhost:8086/query --data-urlencode "q=CREATE DATABASE mta"`
The microservice can now connect to the instance and start saving measurements in the `mta` database using the Java driver. In order to use the Java driver, the below Maven dependency must be added first:
```
org.influxdb
influxdb-java
2.14
```
Configuring the java client is very simple and the `InfluxDB` interface will later be used to query the database.
```
// Init influxDB
InfluxDB influxDB = InfluxDBFactory.connect("http://127.0.0.1:8086", "root", "root");
influxDB.setDatabase("mta");
```
## Measurements saving
In [part 1](https://blog.ippon.tech/nyc-subway-data-with-kafka-streams-and-jhipster-part-1/), the Kafka `mta-stream` topic was used to store the results from the streaming process. This topic will be used to save each message in InfluxDB since a message represents the number of active subways for a given line and time.
```
@StreamListener(MessagingConfiguration.MtaStream.INPUT)
public void saveSubwayCount(SubwayCount subwayCount) {
// Save measurement in influxdb
influxDB.write(Point.measurement("line")
.time(subwayCount.getStart().toEpochMilli(), TimeUnit.MILLISECONDS)
.tag("route", subwayCount.getRoute())
.addField("count", subwayCount.getCount())
.build());
}
```
The method above gets triggered when a message is published in the `mta-stream` topic and will then write the message in InfluxDB. Spring Cloud Stream makes things simple by converting the Kafka message from a JSON format to the custom `SubwayCount` class.
InfluxDB's measurement is conceptually similar to a table and all messages are inserted in the `line` measurement. The subway's route is used as a tag to allow filtering when it will be used in Grafana. There is only one field for the point and it is the number of active subways. Finally the time of the point is the start timestamp of Kafka's window.
# Grafana configuration and dashboard creation
Once again, thanks to Docker for making the Grafana setup easy:
`docker run -d -p 3000:3000 grafana/grafana`
A data source for InfluxDB must be created in order to build a dashboard, here is a screenshot of my configuration:
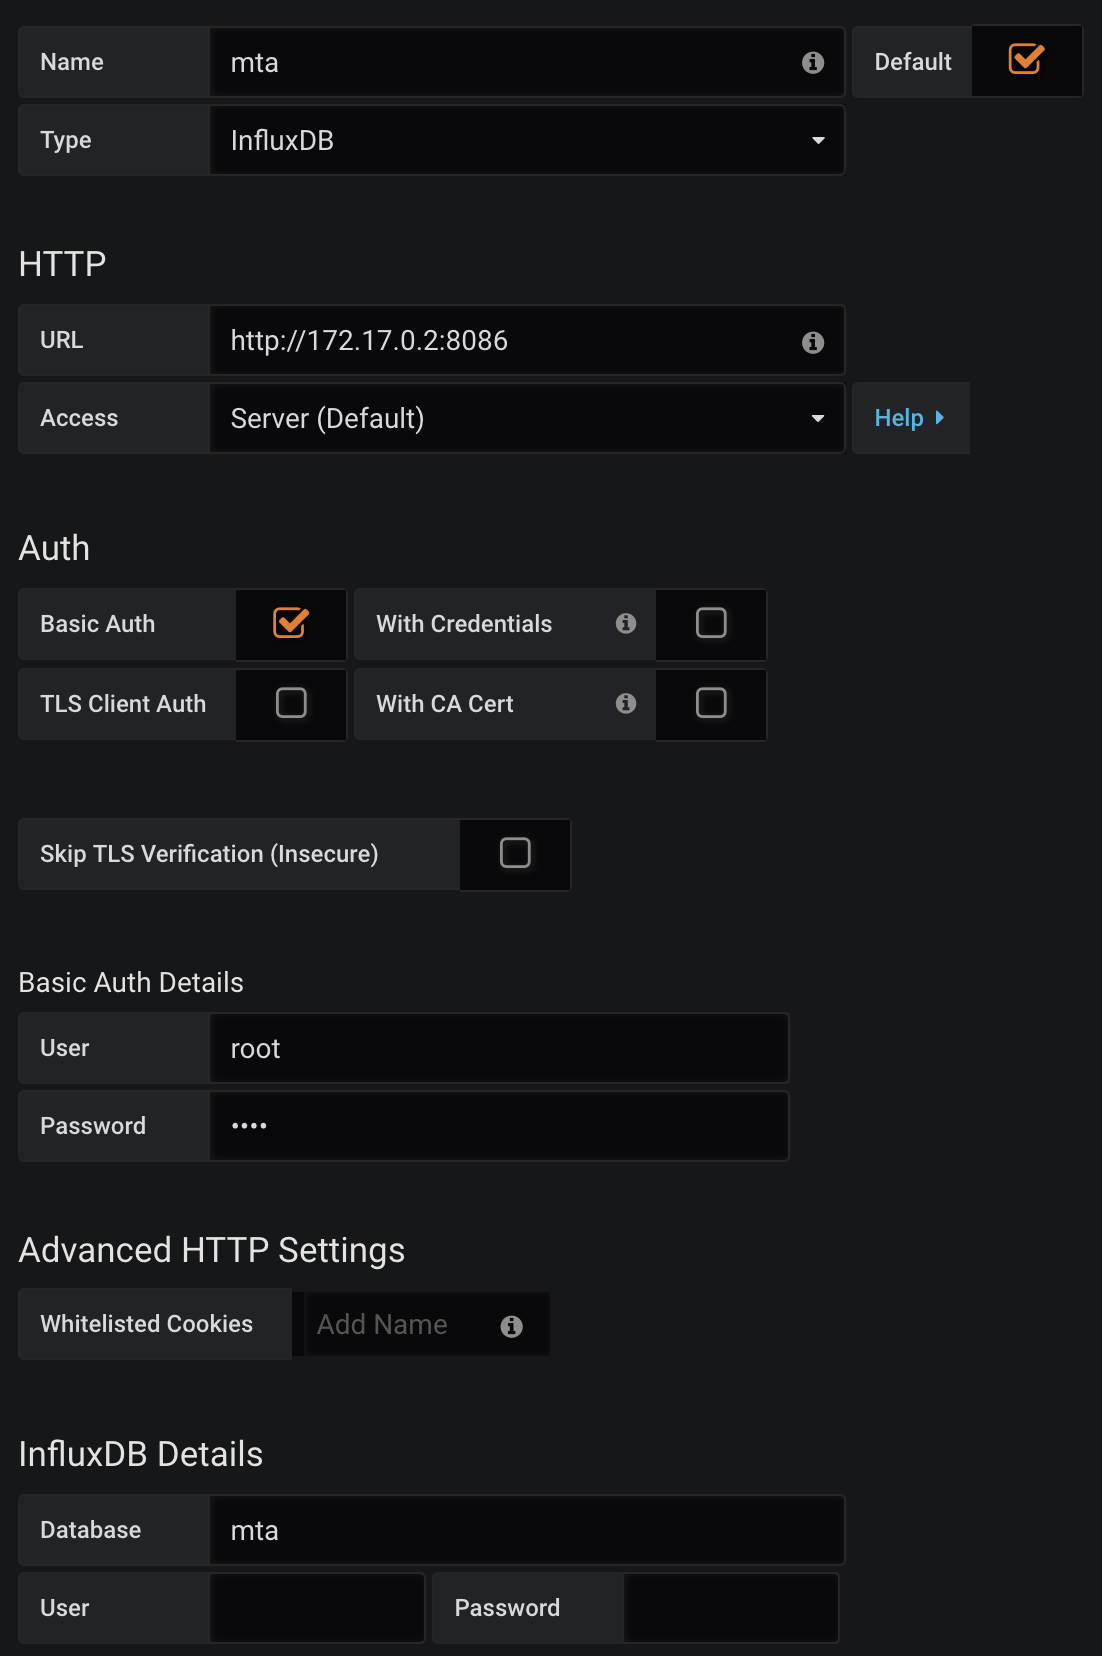
The IP must be the one of the InfluxDB's container, it can be retrieved using the command below:
`docker inspect -f '' container_name_or_id`
Any dashboard can be created with the datasource. I decided to have one with a panel that will display the number of subways per line.
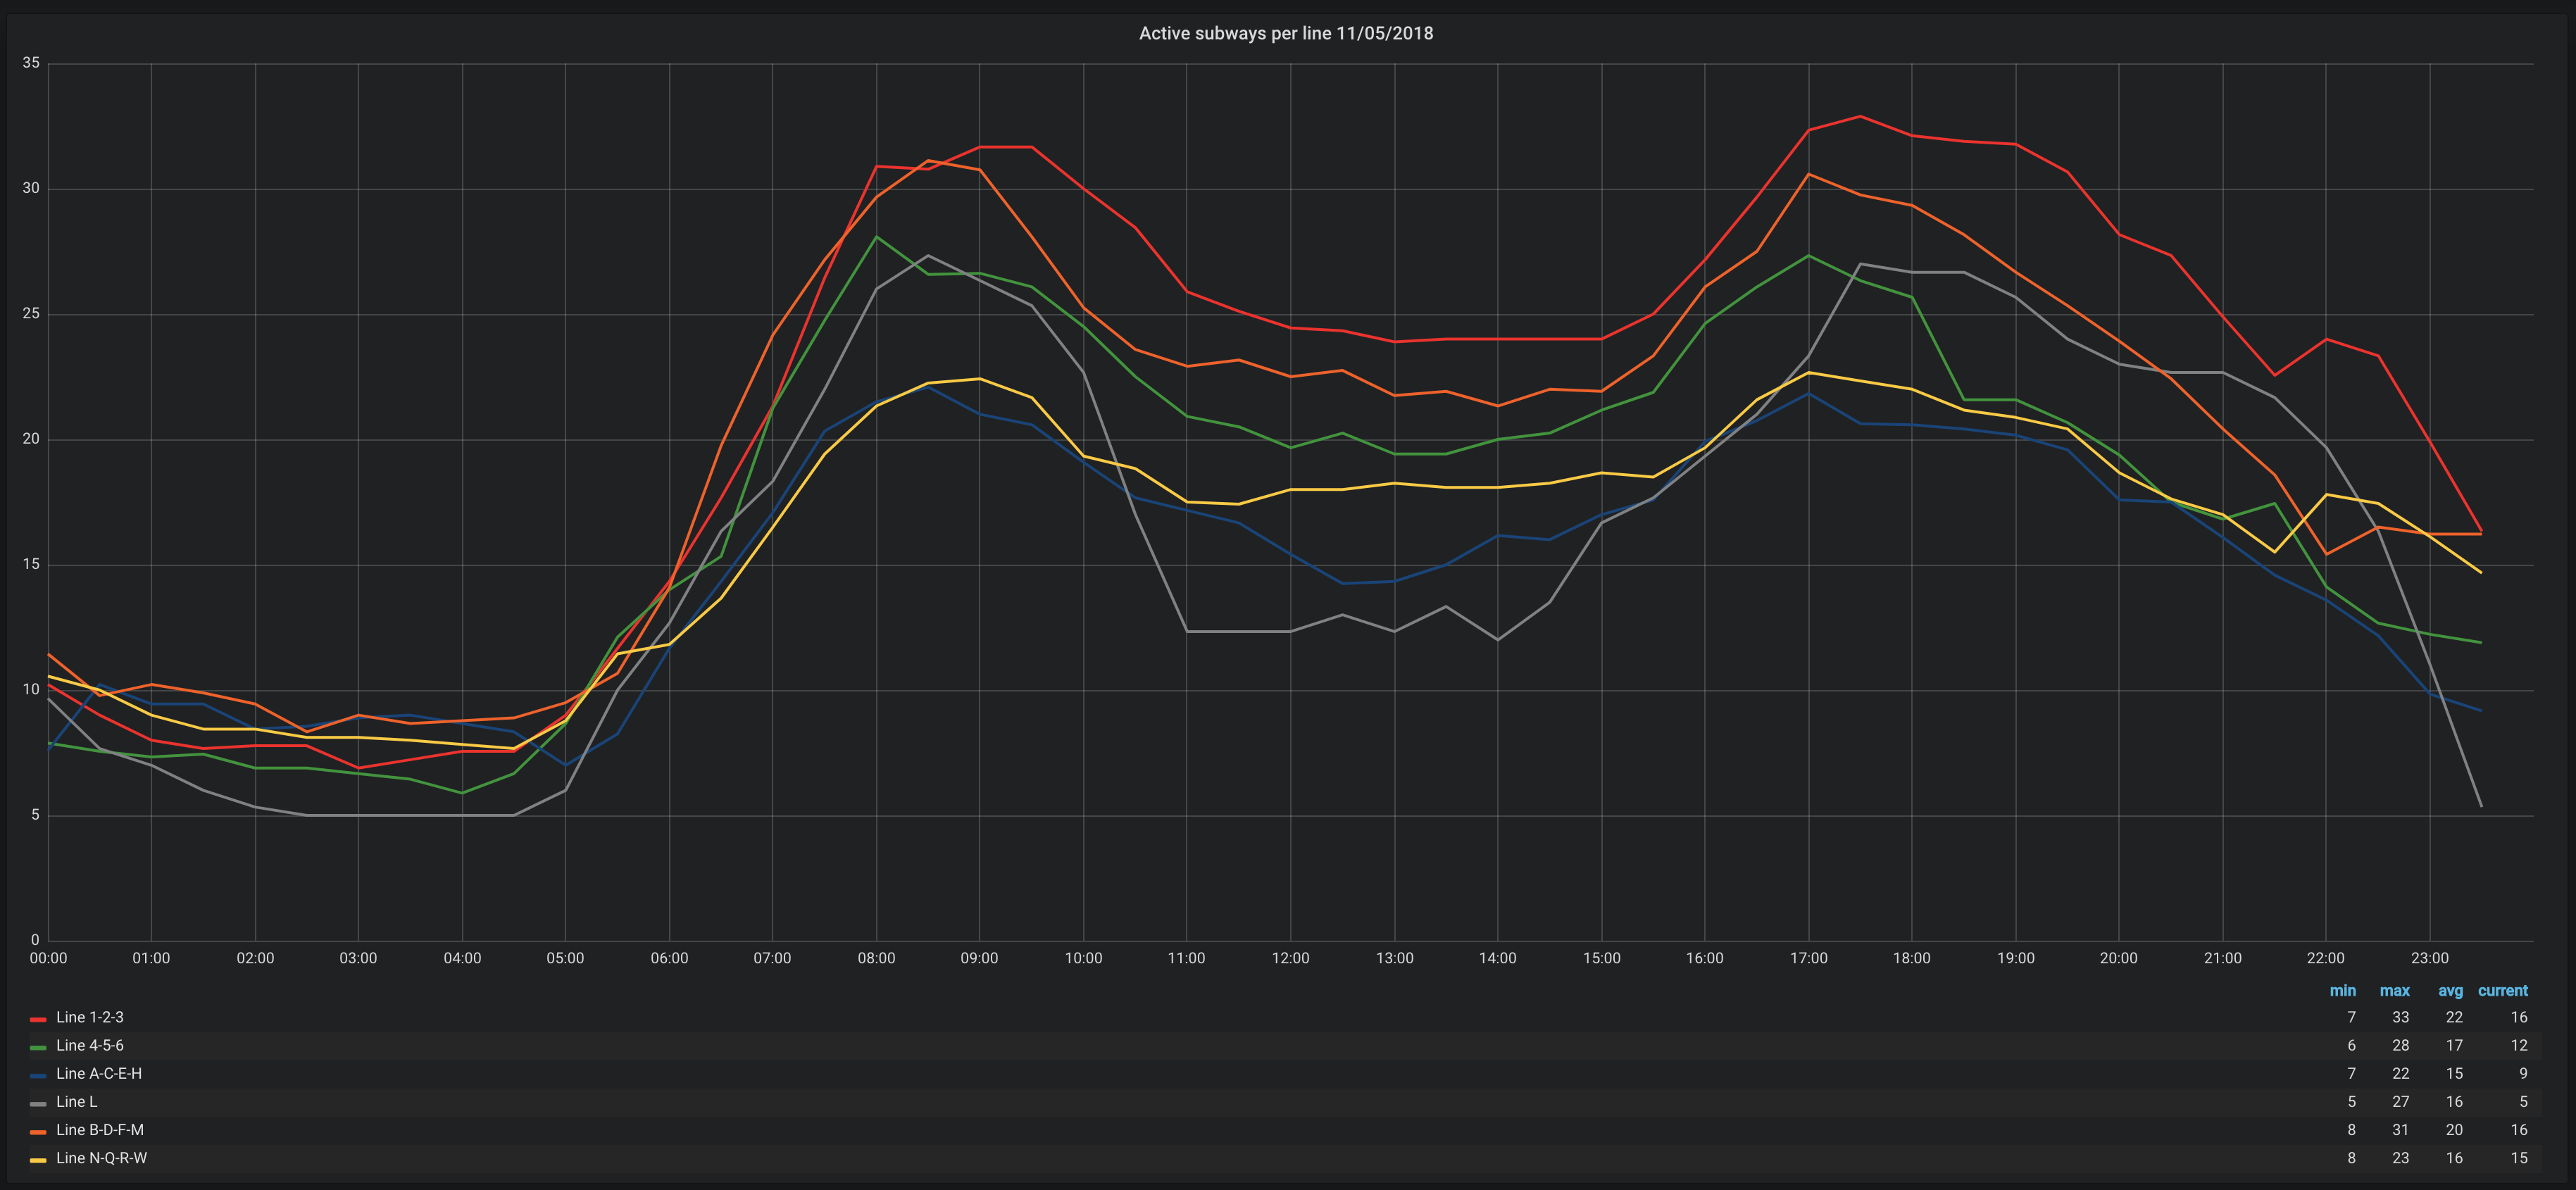
Lines are grouped to avoid having too many series and the value is the average number of running trains for a 30mins interval. The above screenshot shows the busiest lines on Monday, November 5, 2018 which is a regular work day.
This [JSON configuration](https://raw.githubusercontent.com/Falydoor/mta-kafka/master/dashboard.json?ref=blog.ippon.tech) contains a dashboard with the panel from the screenshot and it can be easily imported in a different Grafana instance.
# Conclusion
From the screenshot, we can see that the two times when the number of active subways reach its peak are 9am and 5pm. The time of the day where the number is the lowest is between midnight and 5am. The red line (or 1-2-3) is the one with the most running trains on average during a day which makes sense since it is one of the longest lines.
Using JHipster with Kafka and Spring Cloud Stream is pretty straightforward and the integration with the MTA API was easy to do. Setting up InfluxDB/Grafana with Docker takes a few minutes and it gives you a nice way to visualize the data. The next step would be to differentiate the direction for each line because there is probably a small difference between two directions of the same line.
## Related Articles
##### [ Data • November 2, 2021 Event-Driven Architecture:Getting Started with Kafka (part 2) 9 min read](https://blog.ippon.tech/event-driven-architecture-getting-started-with-kafka-part-2)
##### [ Data • October 26, 2021 Event-Driven Architecture:Getting Started with Kafka (part 1) 9 min read](https://blog.ippon.tech/event-driven-architecture-getting-started-with-kafka-part-1)
##### [ Data • June 7, 2019 Confluent & Twitter4j Tutorial 6 min read](https://blog.ippon.tech/confluent-kafka-twitter4j)
### Comments
### Subscribe to Our Blog!
Stay informed with the latest insights and updates by signing up for our weekly blog newsletter – delivered straight to your inbox!
[Back to blog homepage »](https://blog.ippon.tech/)

Ippon is a consulting and expertise firm, who is convinced that technology is a source of progress for society. We help our clients leverage their digital assets to design an appropriate strategy and deploy their transformation roadmap at scale.
#### Navigation
- [Home](https://ipponusa.com/)
- [About](https://ipponusa.com/about-us/)
- [Services](https://ipponusa.com/services/)
- [Blogs](https://blog.ippon.tech/?__hstc=223043268.1036d82247623b329dfefe4e92697801.1714729179243.1714729179243.1714729179243.1&__hssc=223043268.2.1714729179244&__hsfp=803678701)
- [eBooks](https://ipponusa.com/ebooks/)
- [The Data Pour](https://info.ippon.tech/the-data-pour?__hstc=223043268.1036d82247623b329dfefe4e92697801.1714729179243.1714729179243.1714729179243.1&__hssc=223043268.2.1714729179244&__hsfp=803678701)
[Contact Us](https://ipponusa.com/contact/)
[Join Us](https://ipponusa.com/careers/)
#### Services
- [Data & Analytics](https://ipponusa.com/service/data-analytics/)
- [Cloud Strategy](https://ipponusa.com/service/cloud-strategy/)
- [Artificial Intelligence](https://ipponusa.com/service/artificial-intelligence/)
- [Operating Model](https://ipponusa.com/service/operating-model/)
- [Platform Modernization](https://ipponusa.com/service/platform-moderization/)
- [Product Innovation](https://ipponusa.com/service/product-innovation/)
#### Ippon International
- [France](https://fr.ippon.tech/?__hstc=223043268.1036d82247623b329dfefe4e92697801.1714729179243.1714729179243.1714729179243.1&__hssc=223043268.2.1714729179244&__hsfp=803678701)
- [Australia](https://au.ippon.tech/?__hstc=223043268.1036d82247623b329dfefe4e92697801.1714729179243.1714729179243.1714729179243.1&__hssc=223043268.2.1714729179244&__hsfp=803678701)
- #### Contact
- Ippon Technologies
[3431 West Leigh Street Richmond, VA 23230, USA](https://maps.app.goo.gl/RySm6SAwZnsxeiLz9)
- [(844) 477- 6687](tel:8444776687)
- [Sales@ipponusa.com](mailto:Sales@ipponusa.com)
©Copyright 2024 Ippon USA. All Rights Reserved. | [Terms and Conditions](https://ipponusa.com/privacy-policy/) | [Privacy Policy](https://ipponusa.com/privacy-policy/) | [Website by Skol Marketing](https://skolmarketing.com/)
```json
{
"@context" : "https://schema.org",
"@type" : "BlogPosting",
"author" : {
"@type" : "Person",
"name" : "Theo LEBRUN",
"url" : "https://blog.ippon.tech/author/theo-lebrun"
},
"dateModified" : "2024-01-29T16:08:05.074Z",
"datePublished" : "2018-11-07T15:22:00.000Z",
"headline" : "NYC subway data with Kafka Streams and JHipster (part 2 of 2)",
"image" : [ "https://blog.ippon.tech/hubfs/Imported_Blog_Media/mta-kafka-logo-Jan-18-2024-06-08-34-5696-PM.png" ],
"mainEntityOfPage" : {
"@id" : "https://blog.ippon.tech/nyc-subway-data-with-kafka-streams-and-jhipster-part-2",
"@type" : "WebPage"
},
"publisher" : {
"@type" : "Organization",
"logo" : {
"@type" : "ImageObject",
"url" : "https://blog.ippon.tech/hubfs/logo_SVG.svg"
},
"name" : "Ippon Technologies"
}
}
```