

Published November 15, 2022
What is OpenTelemetry
OpenTelemetry (OTel) is an open-source initiative to provide a standardised approach for the capture and distribution of metrics, trace and log data from applications. It defines not just APIs and schemas, but also a set of standard vendor-neutral SDKs and monitoring agents to facilitate collection and exports.
The documentation itself is very detailed, if a little overwhelming in parts. The core to delivering applications that utilise OTel is the OpenTelemetry Collector. The OTel Collector is a small standalone executable that can be run as a sidecar in a container environment, or as a layer if used with something like AWS Lambda.
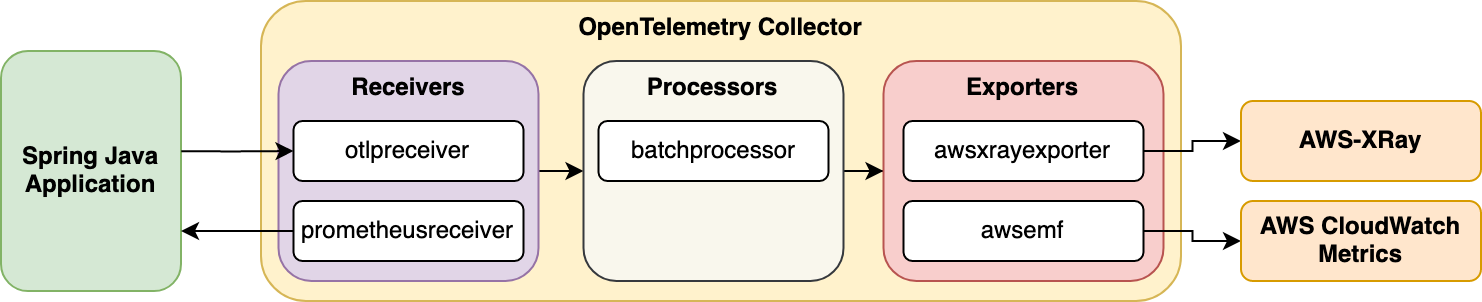
The OTel Collector, at a high level, can be divided into three main parts:
- Receivers: Can, via endpoints, receive data from applications, for example using
otlpreceiver, or they can be configured in a pull mode to scrape data from an application, for example using theprometheusreceiverreceiver. I - Processors: Can bundle/modify the metric/trace/log data as it comes through. The common
batchprocessorgroups and compresses data together to reduce load on exporters. - Exporters: Exporters take the metric/trace/log data and export it to a downstream metric/trace/log solution. So for example, you might want to have trace data analysed with
AWS X-ray, but have log data go to Splunk. In the diagram above, we have metric data going to AWS CloudWatch, using theawsemfexporter.
Arise the OTel Distro
The OTel project released their own standard collector, which includes a bunch of sensible default receivers and exporters. However, what appears to be have happened is that a number of vendors have released expanded distributions of the collector, with additional bundled receivers and exporters to align with their target products. For example AWS has their AWS Distro For Open Telemetry which includes receivers for various AWS container technologies, and exporters for X-ray and CloudWatch. SumoLogic has a distribution which supports exporting to SumoLogic (for both metrics and tracing). These specific distros are great for getting going quickly within a given ecosystem, but can cause issues if you want to route data to multiple providers.
Other providers, such as NewRelic and Honeycomb.io provide HTTP/gRPC endpoints that can directly receive data from the standard otlpexporter exporter, so you can just use the standard collector.
Agents, SDKs, Existing Libraries Oh-My
Now that you understand how the collector works, the next step is getting your valuable application data into the collector. This is going to very much depend on the language your application is written in. In Java land, besides a manual SDK, there is support for an agent-based automatic connector, which out of the box has a lot of support for popular Java libraries. If you would rather not use an agent-based approach, the OpenTelemetry project has an alternative mechanism for injecting trace behaviour specifically for SpringBoot.
SpringBoot doesn't yet support OpenTelemetry natively out of the box, but does support a number of metric export mechanisms, including Prometheus. In this case, the collector can be configured with a prometheus receiver on the collector, which will scrape metrics from SpringBoot at a defined interval.
If you're looking into Quarkus, it supports only tracing currently.
How do I use it with AWS?
AWS has some detailed documentation around integrating with their various services, with X-Ray being the target for tracing information. A common deployment pattern is using the collector as an ECS side-car, which will accept tracing data generated from a primary app, and then diseminate it to X-Ray for evaluation.
The following is a sample CDK pattern, which deploys a Quarkus app (as described in their documentation), into ECS.
import * as cdk from 'aws-cdk-lib';
import { Construct } from 'constructs';
import {aws_ec2, aws_ecr_assets, aws_ecs, aws_ecs_patterns, aws_iam} from "aws-cdk-lib";
import {DockerImageAsset, NetworkMode} from "aws-cdk-lib/aws-ecr-assets";
import * as path from "path";
import {ContainerImage} from "aws-cdk-lib/aws-ecs";

export class OtelDemoStack extends cdk.Stack {
    constructor(scope: Construct, id: string, props?: cdk.StackProps) {
        super(scope, id, props);

        const defaultVPC = aws_ec2.Vpc.fromLookup(this, 'ImportVPC',{isDefault: true});

        const cluster = new aws_ecs.Cluster(this, "OtelCluster", {
            vpc: defaultVPC
        });

        //
        const dockerImageServiceB = new DockerImageAsset(this, 'OtelBuildServiceB', {
            directory: path.join(__dirname, '../','../','service_b'),
            networkMode: NetworkMode.HOST,
            file: 'src/main/docker/Dockerfile.jvm',
            platform: aws_ecr_assets.Platform.LINUX_AMD64,
            ignoreMode: undefined,
        })

        const otelPolicy = new aws_iam.PolicyDocument({
            statements: [new aws_iam.PolicyStatement({
                actions: [
                    'logs:PutLogEvents',
                    'logs:CreateLogGroup',
                    'logs:CreateLogStream',
                    'logs:DescribeLogStreams',
                    'logs:DescribeLogGroups',
                    'xray:PutTraceSegments',
                    'xray:PutTelemetryRecords',
                    'xray:GetSamplingRules',
                    'xray:GetSamplingTargets',
                    'xray:GetSamplingStatisticSummaries'
                ],
                resources: ['*'],
            })],
        });

        const taskRole = new aws_iam.Role(this, 'Role', {
            assumedBy: new aws_iam.ServicePrincipal('ecs-tasks.amazonaws.com'),
            inlinePolicies: {
                otelPolicy
            }
        });

        const fargateTaskDefinition = new aws_ecs.FargateTaskDefinition(this, 'TaskDef', {
            memoryLimitMiB: 512,
            cpu: 256,
            taskRole: taskRole
        });
        let webcontainer = fargateTaskDefinition.addContainer("WebContainer", {
            image: ContainerImage.fromDockerImageAsset(dockerImageServiceB),
            logging: new aws_ecs.AwsLogDriver({ streamPrefix: 'ServiceB', mode: aws_ecs.AwsLogDriverMode.NON_BLOCKING })
        });
        webcontainer.addPortMappings({
            containerPort: 8080,
        });
        fargateTaskDefinition.addContainer("Otel", {
            image: aws_ecs.ContainerImage.fromRegistry('amazon/aws-otel-collector:latest'),
            logging: new aws_ecs.AwsLogDriver({ streamPrefix: 'ServiceBOtel', mode: aws_ecs.AwsLogDriverMode.NON_BLOCKING }),
            command: ['--config=/etc/ecs/ecs-default-config.yaml', '--set=service.telemetry.logs.level=DEBUG']
        });

        // // Create a load-balanced Fargate service and make it public
        let serviceB = new aws_ecs_patterns.ApplicationLoadBalancedFargateService(this, "SampleOtelService", {
            cluster: cluster,
            cpu: 512,
            desiredCount: 1,
            taskDefinition: fargateTaskDefinition,
            assignPublicIp: true, // this is purely to not require a NAT option.
            memoryLimitMiB: 1024,
            publicLoadBalancer: true,
            healthCheckGracePeriod: cdk.Duration.seconds(10),
        });
        dockerImageServiceB.repository.grantPull(serviceB.taskDefinition.obtainExecutionRole());

    }
}
It's important to note, that X-ray currently requires a specific time based ID format, which Quarkus discusses in this section. You effectively need to use the X-Ray IDGenerator, or nothing will appear in the X-ray console.
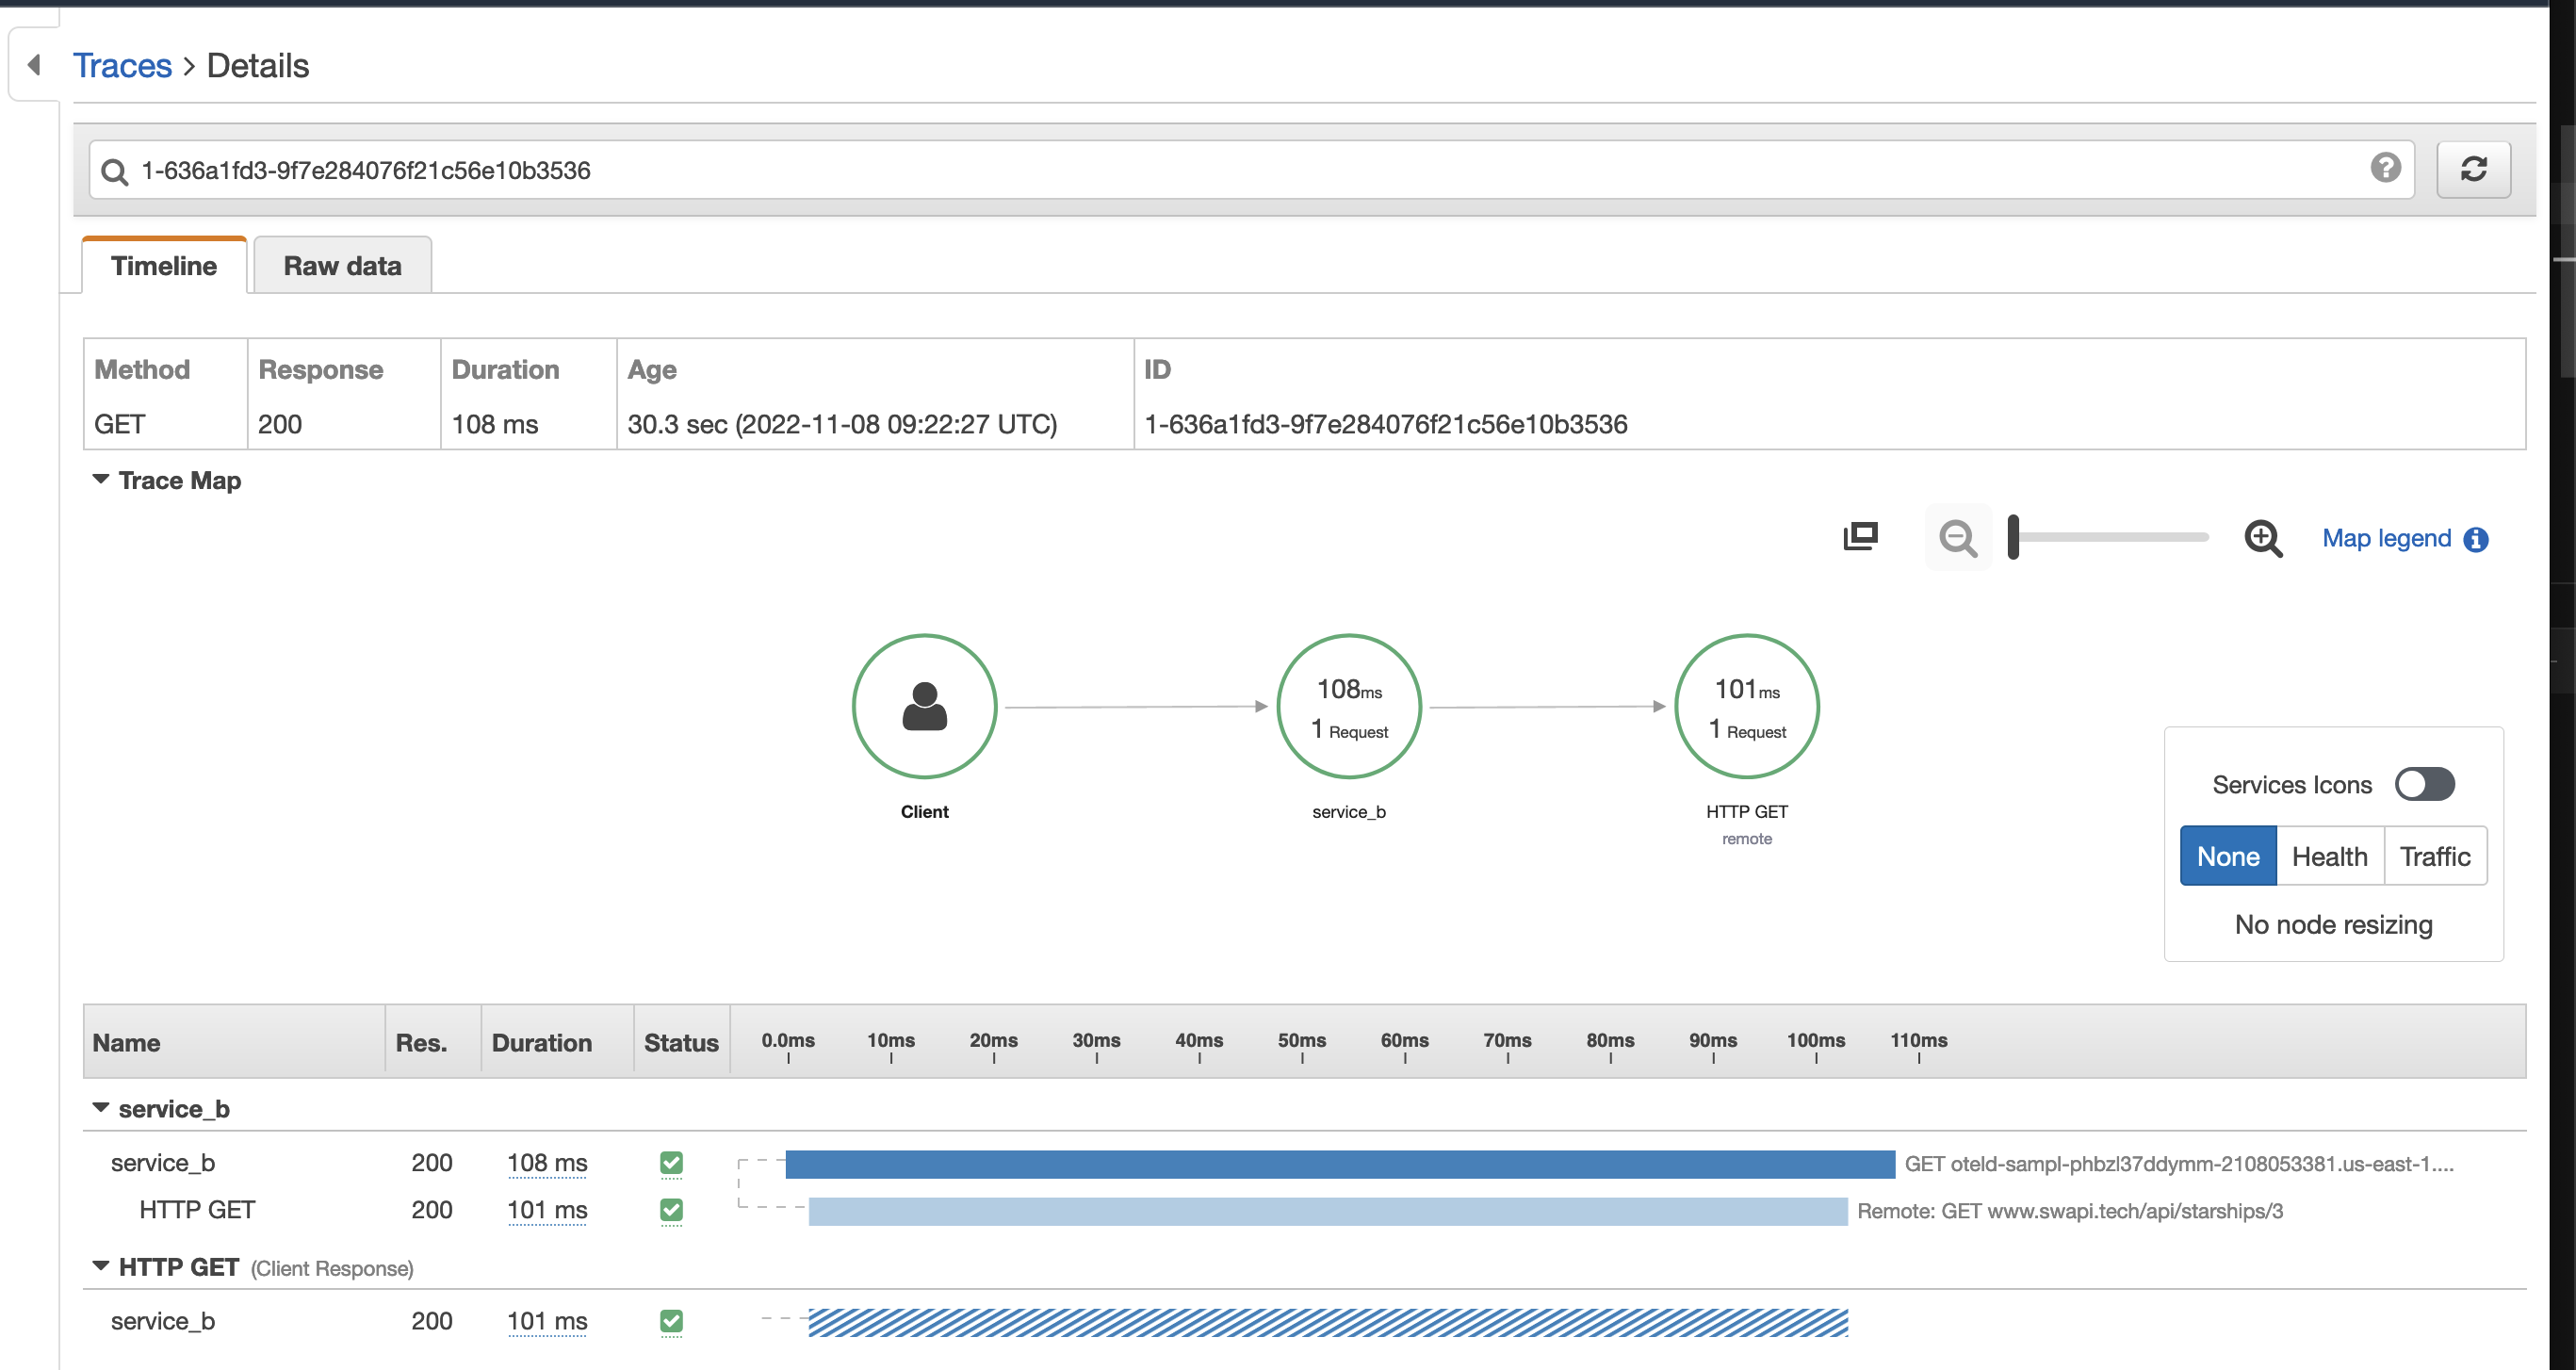
The X-ray console looks like the following. This example demonstrates hitting a sample /hello endpoint, via the deployed load-balancer, hitting the Quarkus application, and then making a HTTP GET call to a Star Wars test endpoint: https://www.swapi.tech/api/starships/3.
Why/When Would I Use It?
It's a great way of integrating metric and trace monitoring into new applications, or applications that don't have existing solutions in this space. I've excluded logging for the moment as the specification is still in a draft status at the time of writing, but it is certainly an exciting development. This is a pretty fast moving space, which will mature and solidify over time, but it will be the way of integrating vendor-agnostic tracing/metric/logging functionality into your application moving forward.
Conclusion
If you're starting a new project, or retrofitting metric and tracing support to an existing application, defintiely look into OpenTelemetry. It provides a solid, standards compliant mechanism to surface application telemetry, and works well even if you haven't yet decided on your downstream vendors as yet. Stop waiting and start exporting!

Comments