
How to ensure our HA configuration is reliable and effective?
Once the infrastructure is ready to host our HA Keycloak servers, it is necessary to check a couple of things (the list is not exhaustive, we are focusing here on performance aspects):
-
Memory consumption:
Bad cache configuration or too small instance types can lead to memory leaks or overrun the JVM garbage collection which could end up impacting performance.
Note that in AWS, this metric is absent, it is mandatory to install an agent on the EC2 instance.
-
CPU usage:
In Keycloak, we have seen that the CPU is the first thing to monitor. It is interesting to see how the CPU reacts to the load as well as the unload.
-
Response time:
We need to control that elapsed time for each type of request (important to distinguish the different types) remains nearly the same. We will mainly keep an eye on login requests as they are the firsts to be called and the heaviest.
-
Number of errors:
0% is very hard to reach and in our use case losing a session is very annoying but not blocking. Nevertheless, bests efforts should be made to keep the count at the lowest while keeping a balance with a good performance level.
-
Caches are well ‘sharded’ between nodes:
We could prove as an example that sessions are not closed when scaling-in. We can benefit from our load tests to verify that we do not have request errors on refreshed sessions during a scale-in.
-
...
Significative load testing requires many Gatling clients
It is necessary to find the best suited tool that will be able to inject a relatively big amount of requests: the main open source ones that do not need to prove themselves are JMeter, The grinder and Gatling.
We will not do a comparison here, each of them have their cons and pros. We have picked Gatling for 4 reasons:
- its community,
- we are used to it,
- beautiful reports,
- ability to scale the client injectors.
Concerning the last point, it is important to be aware that a significative test will probably hit a single client resource limit. Taken from the Gatling documentation:
“You have to understand that Gatling’s default behavior is to mimic human users with browsers so, each virtual user has its own connections. If you have a high creation rate of users with a short lifespan, you’ll end up opening and closing tons of connections every second. As a consequence, you might run out of resources (such as ephemeral ports, because your OS can’t recycle them fast enough). This behavior makes perfect sense when the load you’re modeling is internet traffic. You then might consider scaling out, for example with FrontLine, our Enterprise product.”
Indeed, our main criteria was to be able to scale out our clients but without buying an enterprise product. In this chapter, we will see how to achieve that with our own simple scaled out architecture.
Few people know that it is possible to launch Gatling with a specific mode, that will write logs without the reports. When it is over, it is possible to concatenate them in a merged report.
If we take a look at the Gatling command usage:
Usage: gatling [options]

 -h, --help               Show help (this message) and exit
 -nr, --no-reports        Runs simulation but does not generate reports
 -ro, --reports-only <directoryName>
                          Generates the reports for the simulation in <directoryName>
 -rsf, --resources-folder <directoryPath>
                          Uses <directoryPath> as the absolute path of the directory where resources are stored
 -rf, --results-folder <directoryPath>
                          Uses <directoryPath> as the absolute path of the directory where results are stored
 -sf, --simulations-folder <directoryPath>
                          Uses <directoryPath> to discover simulations that could be run
 -bf, --binaries-folder <directoryPath>
                          Uses <directoryPath> as the absolute path of the directory where Gatling should produce compiled binaries
 -s, --simulation <className>
                          Runs <className> simulation
 -rd, --run-description <description>
                          A short <description> of the run to include in the report
You would notice the -nr option that prevents report generation, and the -ro that generates only the reports.
Here are a few examples of commands we often use:
-
For running tests with N Gatling clients:
gatling -rf $RESULT_CONTAINER_DIR/$(uuid) -rd '$DESC ### $JAVA_OPTS' -s keycloak.ha.ScalabilityRecordedSimulation -nrwhere:
$RESULT_CONTAINER_DIRis the name of the result directory which will be the same for every client that are related to the same run,$(uuid)generates a unique sub repository to avoid writing the same file,$DESCis the description of the scenario and of what we want to test (for instance: T3A.small - shard 2 - start 3 EC2 - upscale 39p - no affinity etc…), it’s important to be as exhaustive as possible here because it will help to understand better the whole context of the test in the future,- the
$JAVA_OPTSwill contain all the parameters used by your Scala script if any (for instance you can parameterize the number of users, duration, protocols, domain name, pause duration etc.)
-
For generating our index.html report:
gatling -ro $RESULT_CONTAINER_DIR
Scaling Gatling clients with AWS ECS
The use of containers was prohibited in our context on production environments, but nothing keeps us from using them in our test environments.
The easiest way to scale our containers that contains the Gatling client, was to use the container managed service supplied by AWS: ECS (Elastic Container Service).
The ECS configuration is not provided here as there are many examples on the Internet.
Here is the load test architecture diagram:
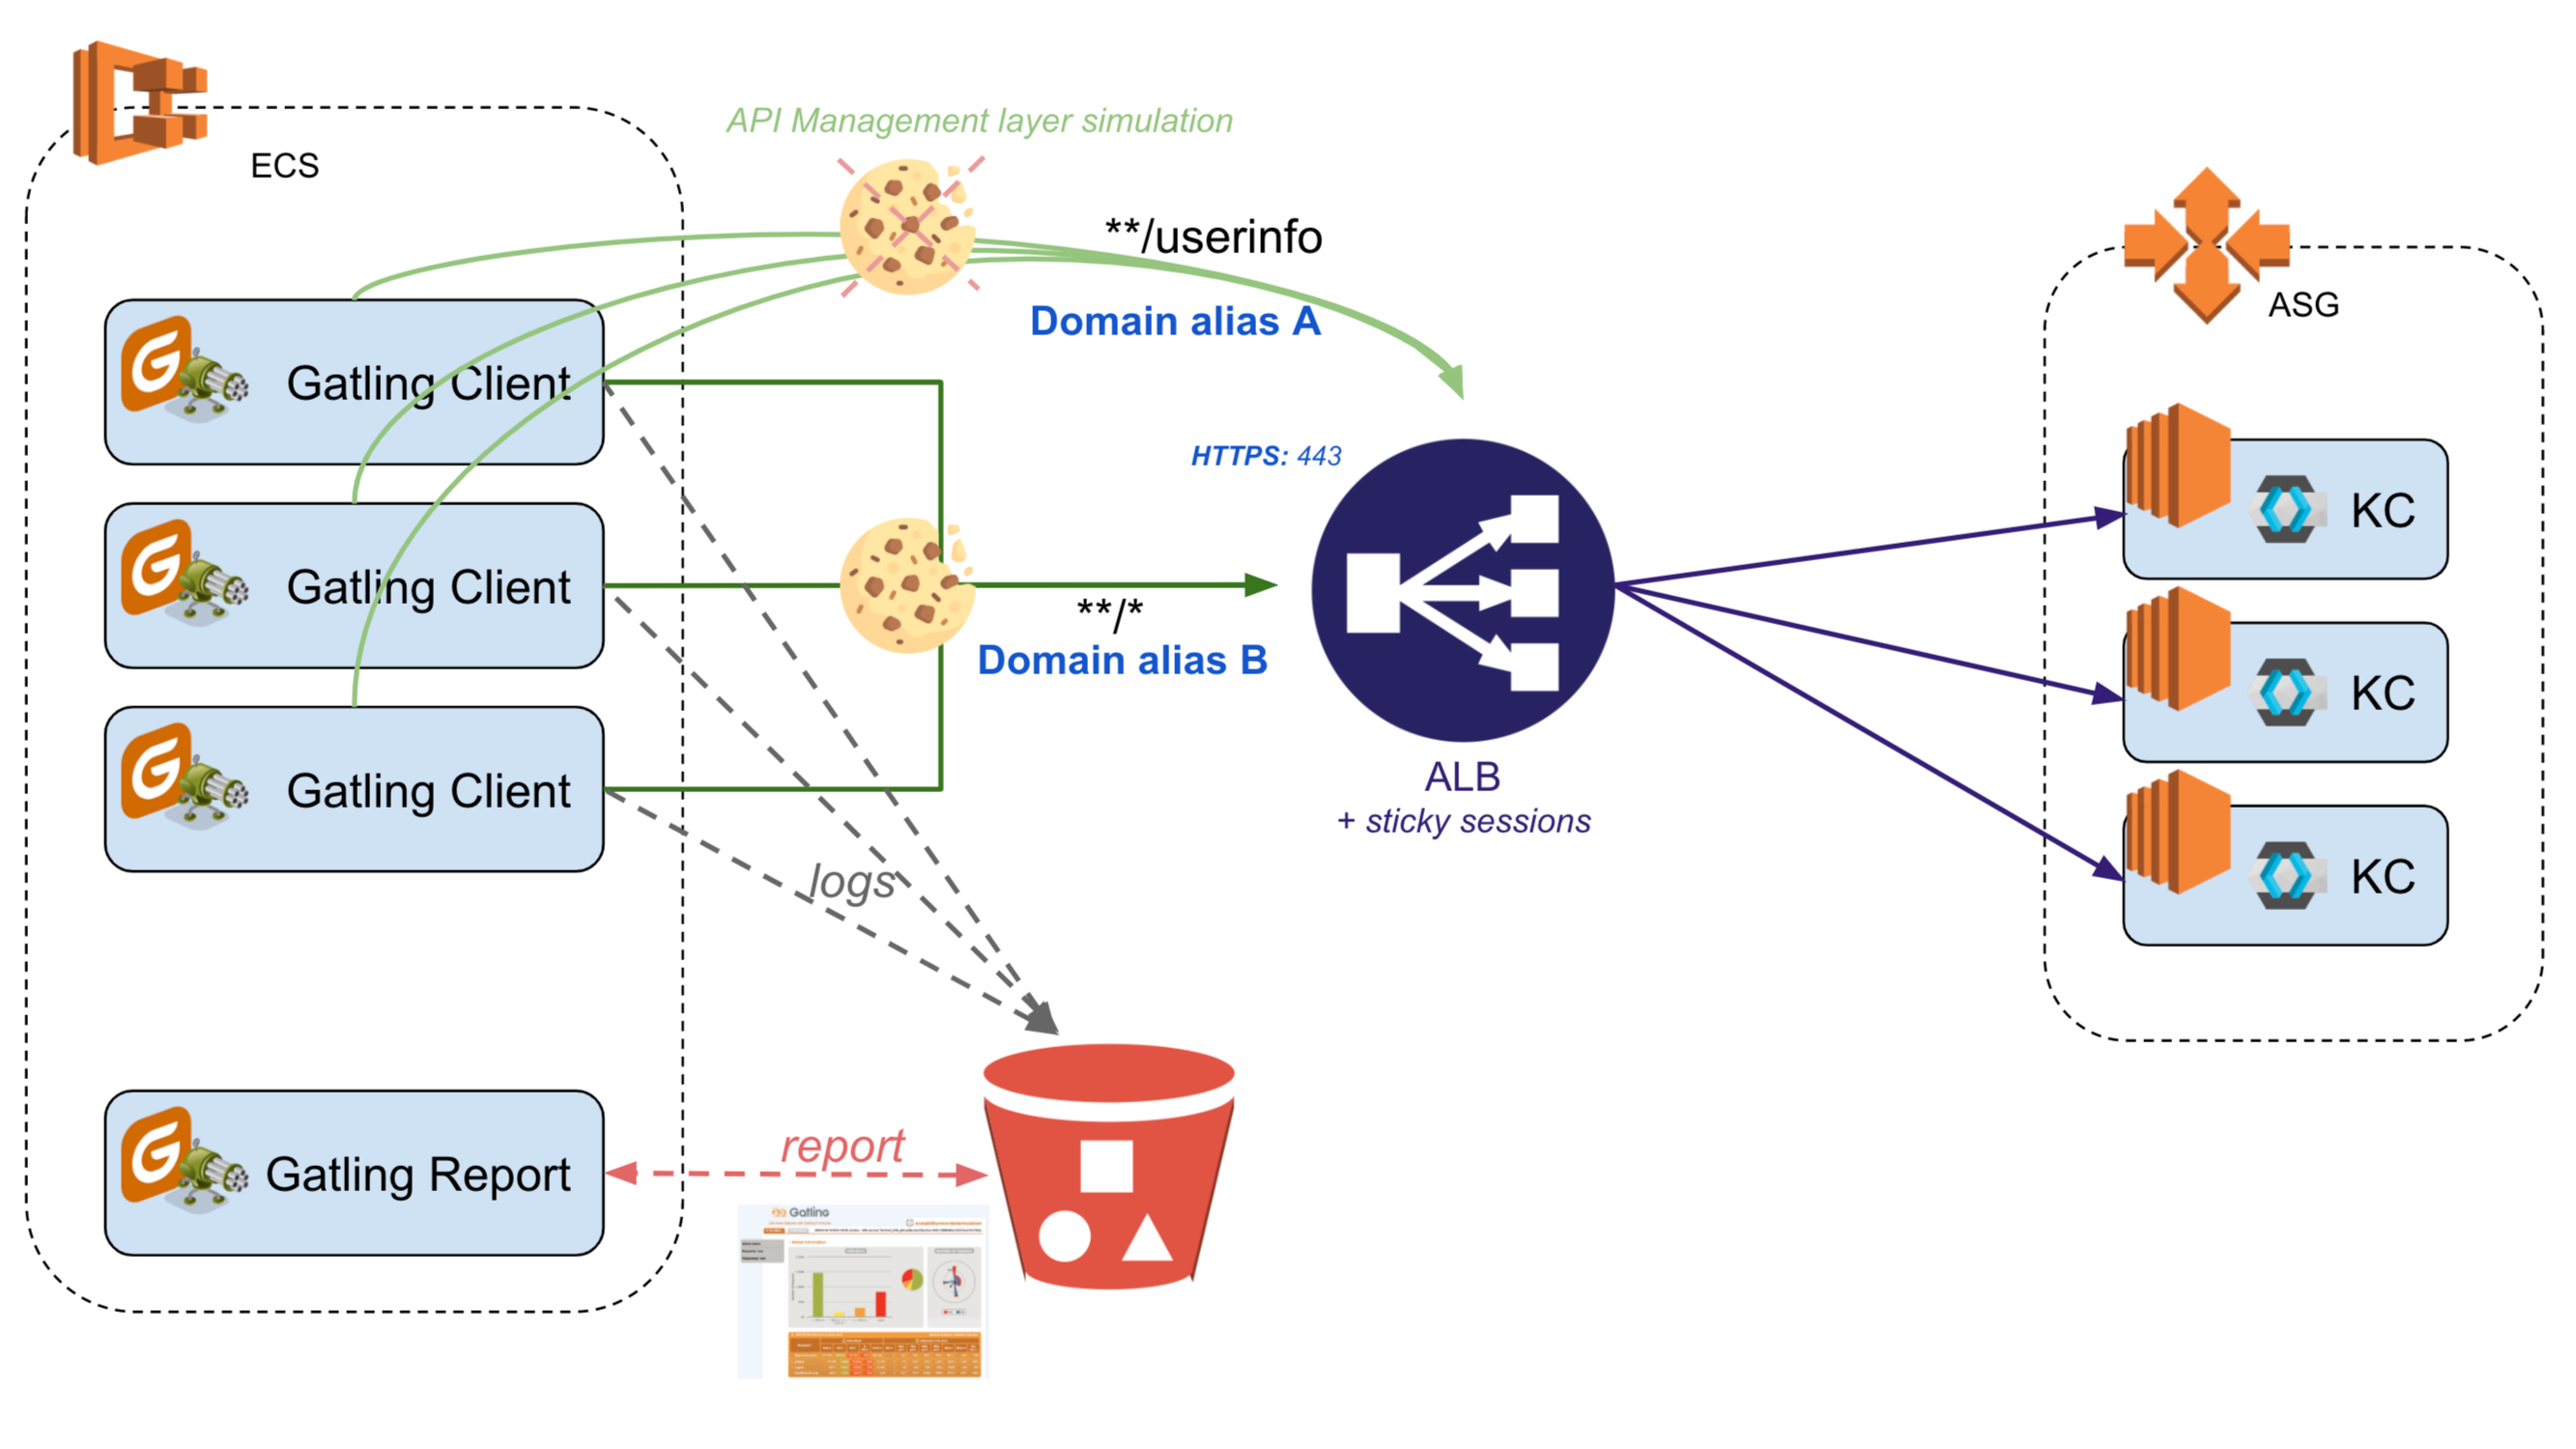
Before entering into the details of the Gatling scenario, it is important to note that the same ALB (our only Keycloak public door) will be requested using 2 different domain aliases:
- the one used for getting access to the console, it is defined in our company DNS server,
- the internal one, the route53 alias (we could have used the public frontal one, but we would have needed to open an additional port and request Internet access to reach it from our ECS VPC, but everyone knows the difficulty in big companies to make it pass the security team agreement).
Why these 2 domains?
- The first one (Domain A) will only be used for the requests done without cookies (otherwise, the affinity session cookie would bias our tests results). In our case, it concerns only the
/userinfoendpoint requests. It would have been too complex for our tests to add another proxy simulating the API management layer (or any other backend security checking layer). On top of that, we did not want to measure this layer overheads. - The second one (Domain B) is used for all requests that the browser will execute.
 The generated files are stored into S3, thus, do not forget to set the required AWS permissions policy on the container:
{
 "Version": "2012-10-17",
 "Statement": [
   {
       "Sid": "gatling-compartiment-policy-ecs",
       "Effect": "Allow",
       "Principal": {
           "AWS": "arn:aws:iam::XXXXXXXX:role/ecsTaskExecutionRoleGatlingS3"
       },
       "Action": "s3:*",
       "Resource": [
           "arn:aws:s3:::gatling-perf-test",
           "arn:aws:s3:::gatling-perf-test/*"
       ]
   }
 ]
}
Preparation is the key: the smallest detail can bias the interpretations...
We have seen that we can highly complexify the tests just to be able to remove the affinity session cookie on the single /userinfo endpoint. If this had not been done, the results would not have represented exactly the reality, and we would not have been able to witness which behavior Keycloak would have had when the cluster had grown or when requests had fallen onto the wrong node.
The approach is not to simply record the network activity (I mean the API calls) respecting the pause, but to really understand what is at stake by taking a step back on the overall architecture and measuring Keycloak performance, not other infrastructure element ones nor the network latency.
Thus, we thought about a scenario that could reproduce all of our OAuth grant type steps with an IFramed Implicit Grant (yes, Implicit Grant can still be secured if all the required actions are taken, but it will not be explained here). This scenario includes login, silent refreshes and token checks (/userinfo). The results with an authorization code grant and PKCE type scenario would probably not have been very far. Then, we extrapolated the injectors parameters to go a little above the expected volumes.
Here are the different steps:
- For each user in a random feeder ({random number}_{default mail})
- Wait a random duration (pause) -- in order to spread the logins
- Do an authentication:
- call navToLogin: do a GET on
/openid-connect/authto get the login page and retrieve the login form action- call login: provide mail/pwd and do a POST on
/login-actions/authenticate(dynamically retrieved from the previous form) of the OIDC endpoint. Retrieve the access_token and expires_in in the Location header response.- put the token in the session for all following requests with the authorization Bearer header
- Calculate a random number of silent refresh loop
- For each silent refresh loop
- While session is not expired, at a parameterized rate:
- call userinfo: request that will retrieve user information on a specific endpoint host if configuration has specified a different one from the others requests.
- call silentrefresh: execute a
/openid-connect/authwith prompt=none url argument to make a silent refresh thanks to the login cookie stored in gatling thread. Retrieve the access_token and update the session with the new token.- call logout:
/openid-connect/logoutendpoint X% of the time
You may have noticed some tiny details that have their importance here:
- We start with a customer feeder -- using only one user would also work with Keycloak as it would separate the user data from his context session (i.e. you could login many times with the same user). Nevertheless, you would not see the memory consumption if the target was to have more than 100K users. Additionally, it would have shown others things that we had not in mind at that time.
- We retrieve the
expires_induration in order to call the silent refresh just before the token expires to avoid unnecessary401(of course the real browser app would have the same behavior). - Random number of silent refresh loop: this will simulate different scenario durations.
- Call logout X% of the time: in the real world, most users do not call the logout endpoint (on e-commerce sites, it is very rare; on company internal tools, it is more common).
We do not see it here, but it is also important to respect realistic pause durations as well as a realistic number of calls on the /userinfo endpoint (each time a backend API call is made; the amount of calls can be very huge).
You may not always be able to simulate the exact reality, but you should be aware that some unexpected behaviors can happen. For example:
“As our scenario begins with the login requests, if the load test makes the CPU increase too much, requests may fail. Thus, the entire user scenario will be in a failed state too and as we use a ‘closed model’ (capped number of concurrent users), it will be immediately replaced with another one which will start again the login steps and emphasize the phenomenon.”
Consequently, with this kind of model we should try to reproduce the reality by trying to login only 2 or 3 times in a row and then wait several minutes instead of letting a new user scenario starts instantly.
One thing left to handle, which is not natively possible with Gatling, is to suppress all client request cookies of the Domain A.
As the session is unique for the Gatling scenario that calls the 2 domains, the trick is to save all the cookies and then restore them, except the ones on domain A, before executing the call.
Here is a little bonus Scala code for this:
   val KC_COOKIES_PATH = "/auth/realms/" + REALM_NAME + "/"
   // Put here all cookies used by keycloak
   val COOKIE_LIST_TO_KEEP = List("AWSALB", "AWSALBCORS", "AUTH_SESSION_ID", "KEYCLOAK_SESSION", "KEYCLOAK_LOCALE",
                   "KEYCLOAK_IDENTITY", "KEYCLOAK_SESSION_LEGACY", "KEYCLOAK_IDENTITY_LEGACY")

   def saveCookieInSessionIfExists(cookieNames: List[String], host: String, path: String, secure: Boolean): io.gatling.core.structure.ChainBuilder = {
       var chain = exec()
       for (cookieName <- cookieNames) {
           chain = chain
           .exec(session => session.set(cookieName, ""))
           .doIf(session => session("gatling.http.cookies").as[String] contains "(" + cookieName + "=" ) { // if cookie name can be found into cookies
               exec(getCookieValue(CookieKey(cookieName).withDomain(host).withPath(path).withSecure(secure).saveAs(cookieName)))
           }
       }
       chain
   }

   def restoreCookieInSession(cookieNames: List[String], host: String, path: String): io.gatling.core.structure.ChainBuilder = {
       var chain = exec()
       for (cookieName <- cookieNames) {
           chain = chain
           .exec(addCookie(Cookie(cookieName, "${" + cookieName + "}").withDomain(host).withPath(path)))
       }
       chain
   }
Then in our scenario:
   val scnScaleOnLoginsAndSilentRefresh = scenario("ScalabilityRecordedSimulation")
       …
    .exec(saveCookieInSessionIfExists(COOKIE_LIST_TO_KEEP, HOST, KC_COOKIES_PATH, true))
    …
    // delete all cookies: we use the native gatling flushSessionCookies()
    .exec(flushSessionCookies)
    // restore all cookies except the ones on domains different from HOST (ie skip /userinfo requests cookies)
    .exec(restoreCookieInSession(COOKIE_LIST_TO_KEEP, HOST, KC_COOKIES_PATH))
    .exec(callToUserInfo)
Now that you are aware of how to launch the load tests with Gatling using an orchestrator, we are going to gather the results and try to analyze them in the last part of our article.

Comments