

The goal of our presentation is not to expose all test results with every change made (around 30 have been achieved to obtain the whole suggested configuration shown in this document -- and it is still not enough). We just want here to select among the latest ones, the most representative to the activity that our website will probably encounter according to the business forecasting and that shows major issues.
What can we deduce from the load tests?
We will focus here on 2 tests:
- one with calls to the
/userinfoendpoint, - one simulating the use of a short cache on the API management layer for the
/userinfoendpoint → very few calls to the endpoint.
Before everything else, we should gather all the conditions/context information of the 2 runs:
-
Users injection plan:
Ramp 0 ⇾ 300 in 300s, stay at 300 during 200s, ramp 300 ⇾ 500 in 450s, stay at 500 during 600s, ramp 500 ⇾ 100 in 400s, stay at 100 during 650s, ramp 100 ⇾ 450 in 500s, stay at 450 during 400s, ramp 450 ⇾ 0 in 100s -
The schedule:
Each injected user pauses first for 10s, does a login, then at a constant rate calls the /userinfo endpoint every 5s. Before token expiration (180s lifetime), it calls the silent refresh endpoint. The session lasts between 1 and 3 times this duration, so randomly 180s, 360s or 540s. At the end, we do a logout for 25% of the session that has successfully logged in. If a refresh or a/userinfocall fails, we retry 3 times the requests (it differs a bit from the reality, but it can provide useful information) -
InferHtml: true (All induce resources like JS, CSS etc. are retrieved) -- no static cache layer
-
Keycloak server configurations:
- Undertow (The Wildfly web server layer) max threads is set at 60 and the queue at 20
- Remove all data on view change at true on JGROUPSPING
- Jgroup protocol version
FDandFRAG3(some anterior tests were done withFD_ALLandFRAG2) - Shard count: 2
- Log level at ERROR (Important to have a low level like in Production)
- Keycloak version: 8.0.2
-
Infrastructure configurations:
- EC2 instance are T3A Small
- They run on Ireland servers with 2 hours delay in spring with France (it explains the delay between our charts)
- Runs are started with 3 running instances and max instance is 15
- 1,28Go memory (Xmx), 3600 blocking timeout (cf. previous JAVA_OPTS options)
- Scale-out rules:
- Limit: 35%
- Cooldown: 60
- Scale-in rules:
- Limit: 18%
- Cooldown: 120
- HealthCheck:
- Type: EC2
- Grace period: 360
- Load balancer timeout: 15s
- Target group:
- HealthCheckIntervalSeconds: 10
- HealthCheckTimeoutSeconds: 8
- HealthyThresholdCount: 2
- UnhealthyThresholdCount: 3
- deregistration_delay.timeout_seconds: 300
- slow_start.duration_seconds: 30
- Aurora max_connections: 1000
Results
Scenario 1 (All /userinfo requests):
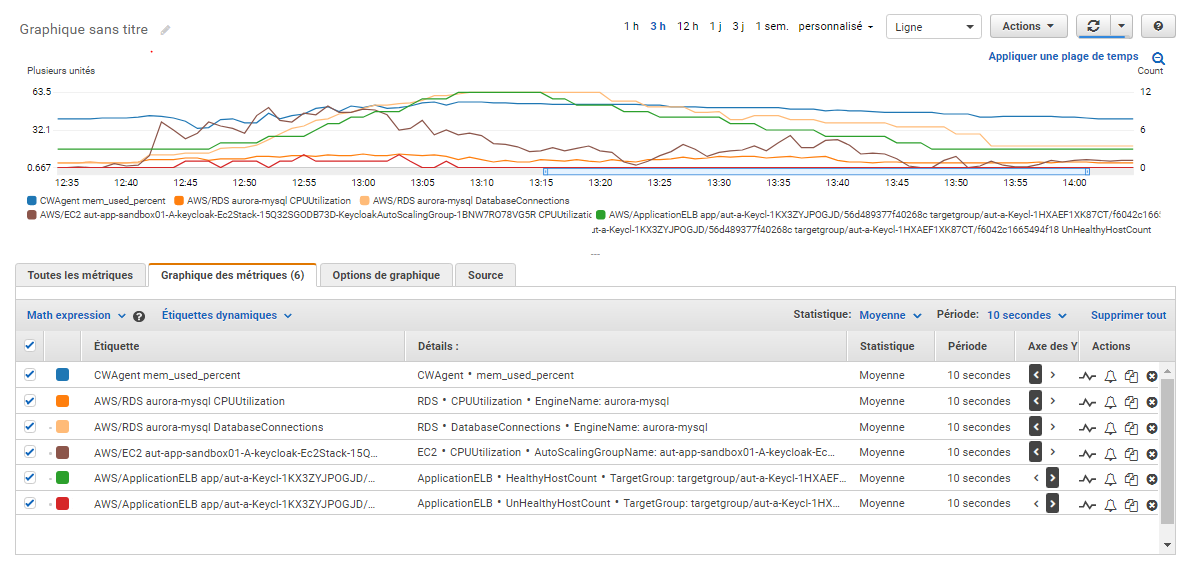
CloudWatch metrics chart (Sorry for the French labels):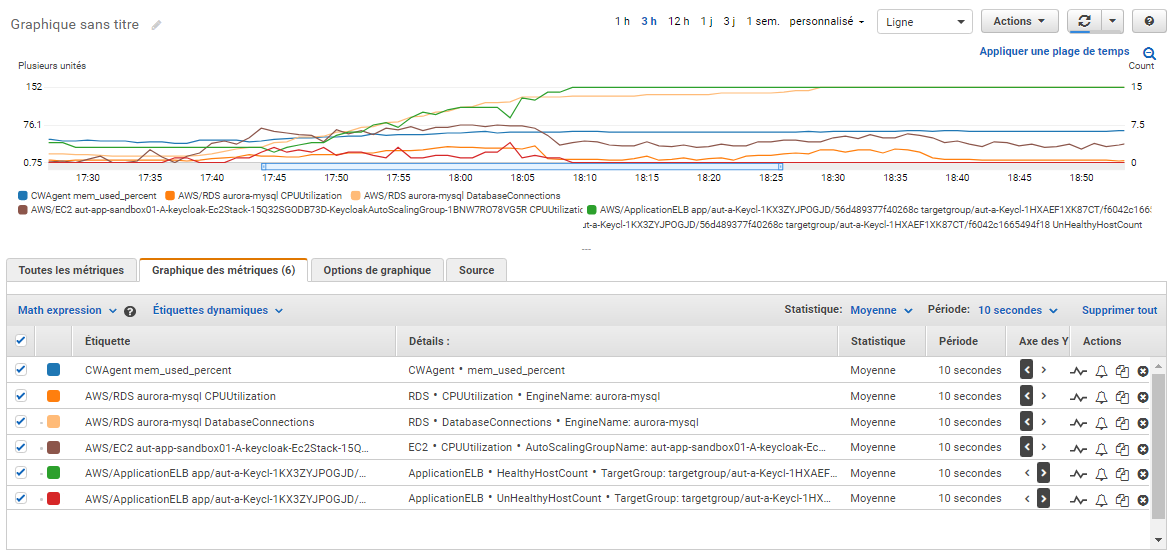
Notes:
- Memory percentage consumption only shifted from 55% to 70%
- Database connections reach 152, the max default value would not have been sufficient (for our database instance type, it would have been 45)
- Database CPU is not stressed
- EC2 CPU reach 70% during the first peak of users, but does not decrease normally (stay at 35%) and then went to 55% during the second peak
- Unhealthy instances sometimes reached 4 during the trouble phase
- Healthy instances reached the limit of the AG max limit of 15, no scale-in due to the CPU that remains very high
Gatling reports:
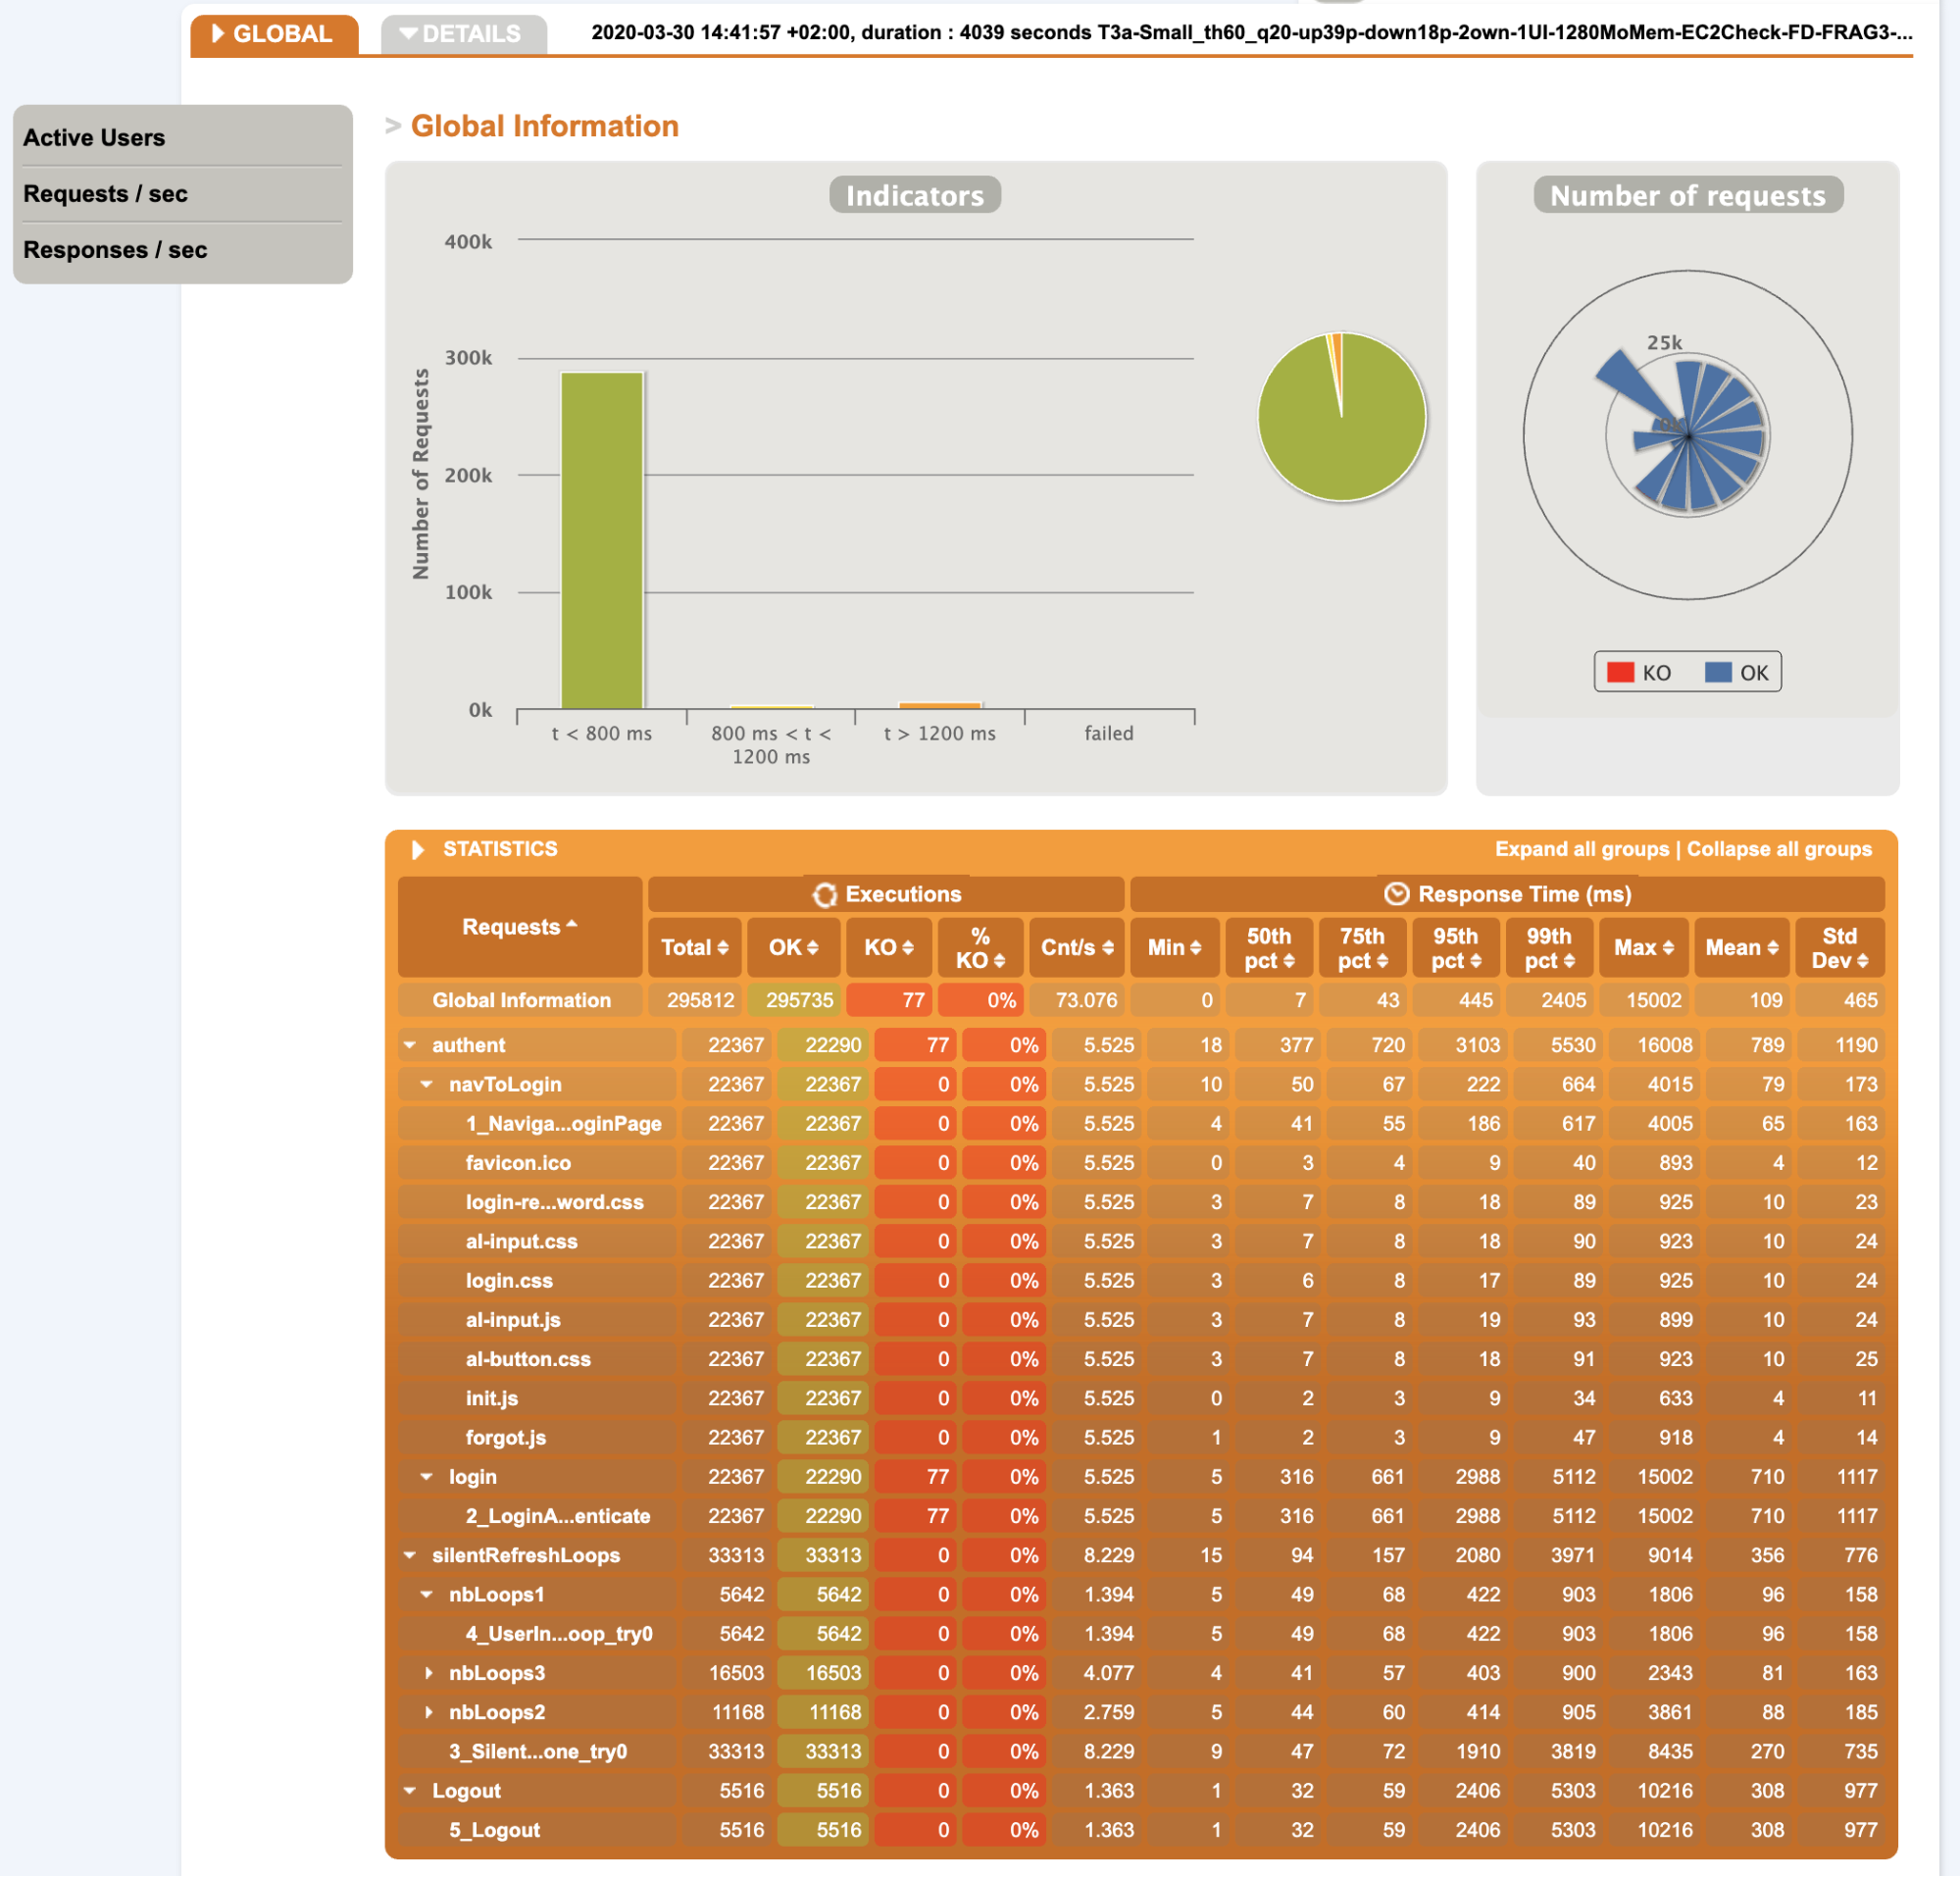
- Overall statistics:
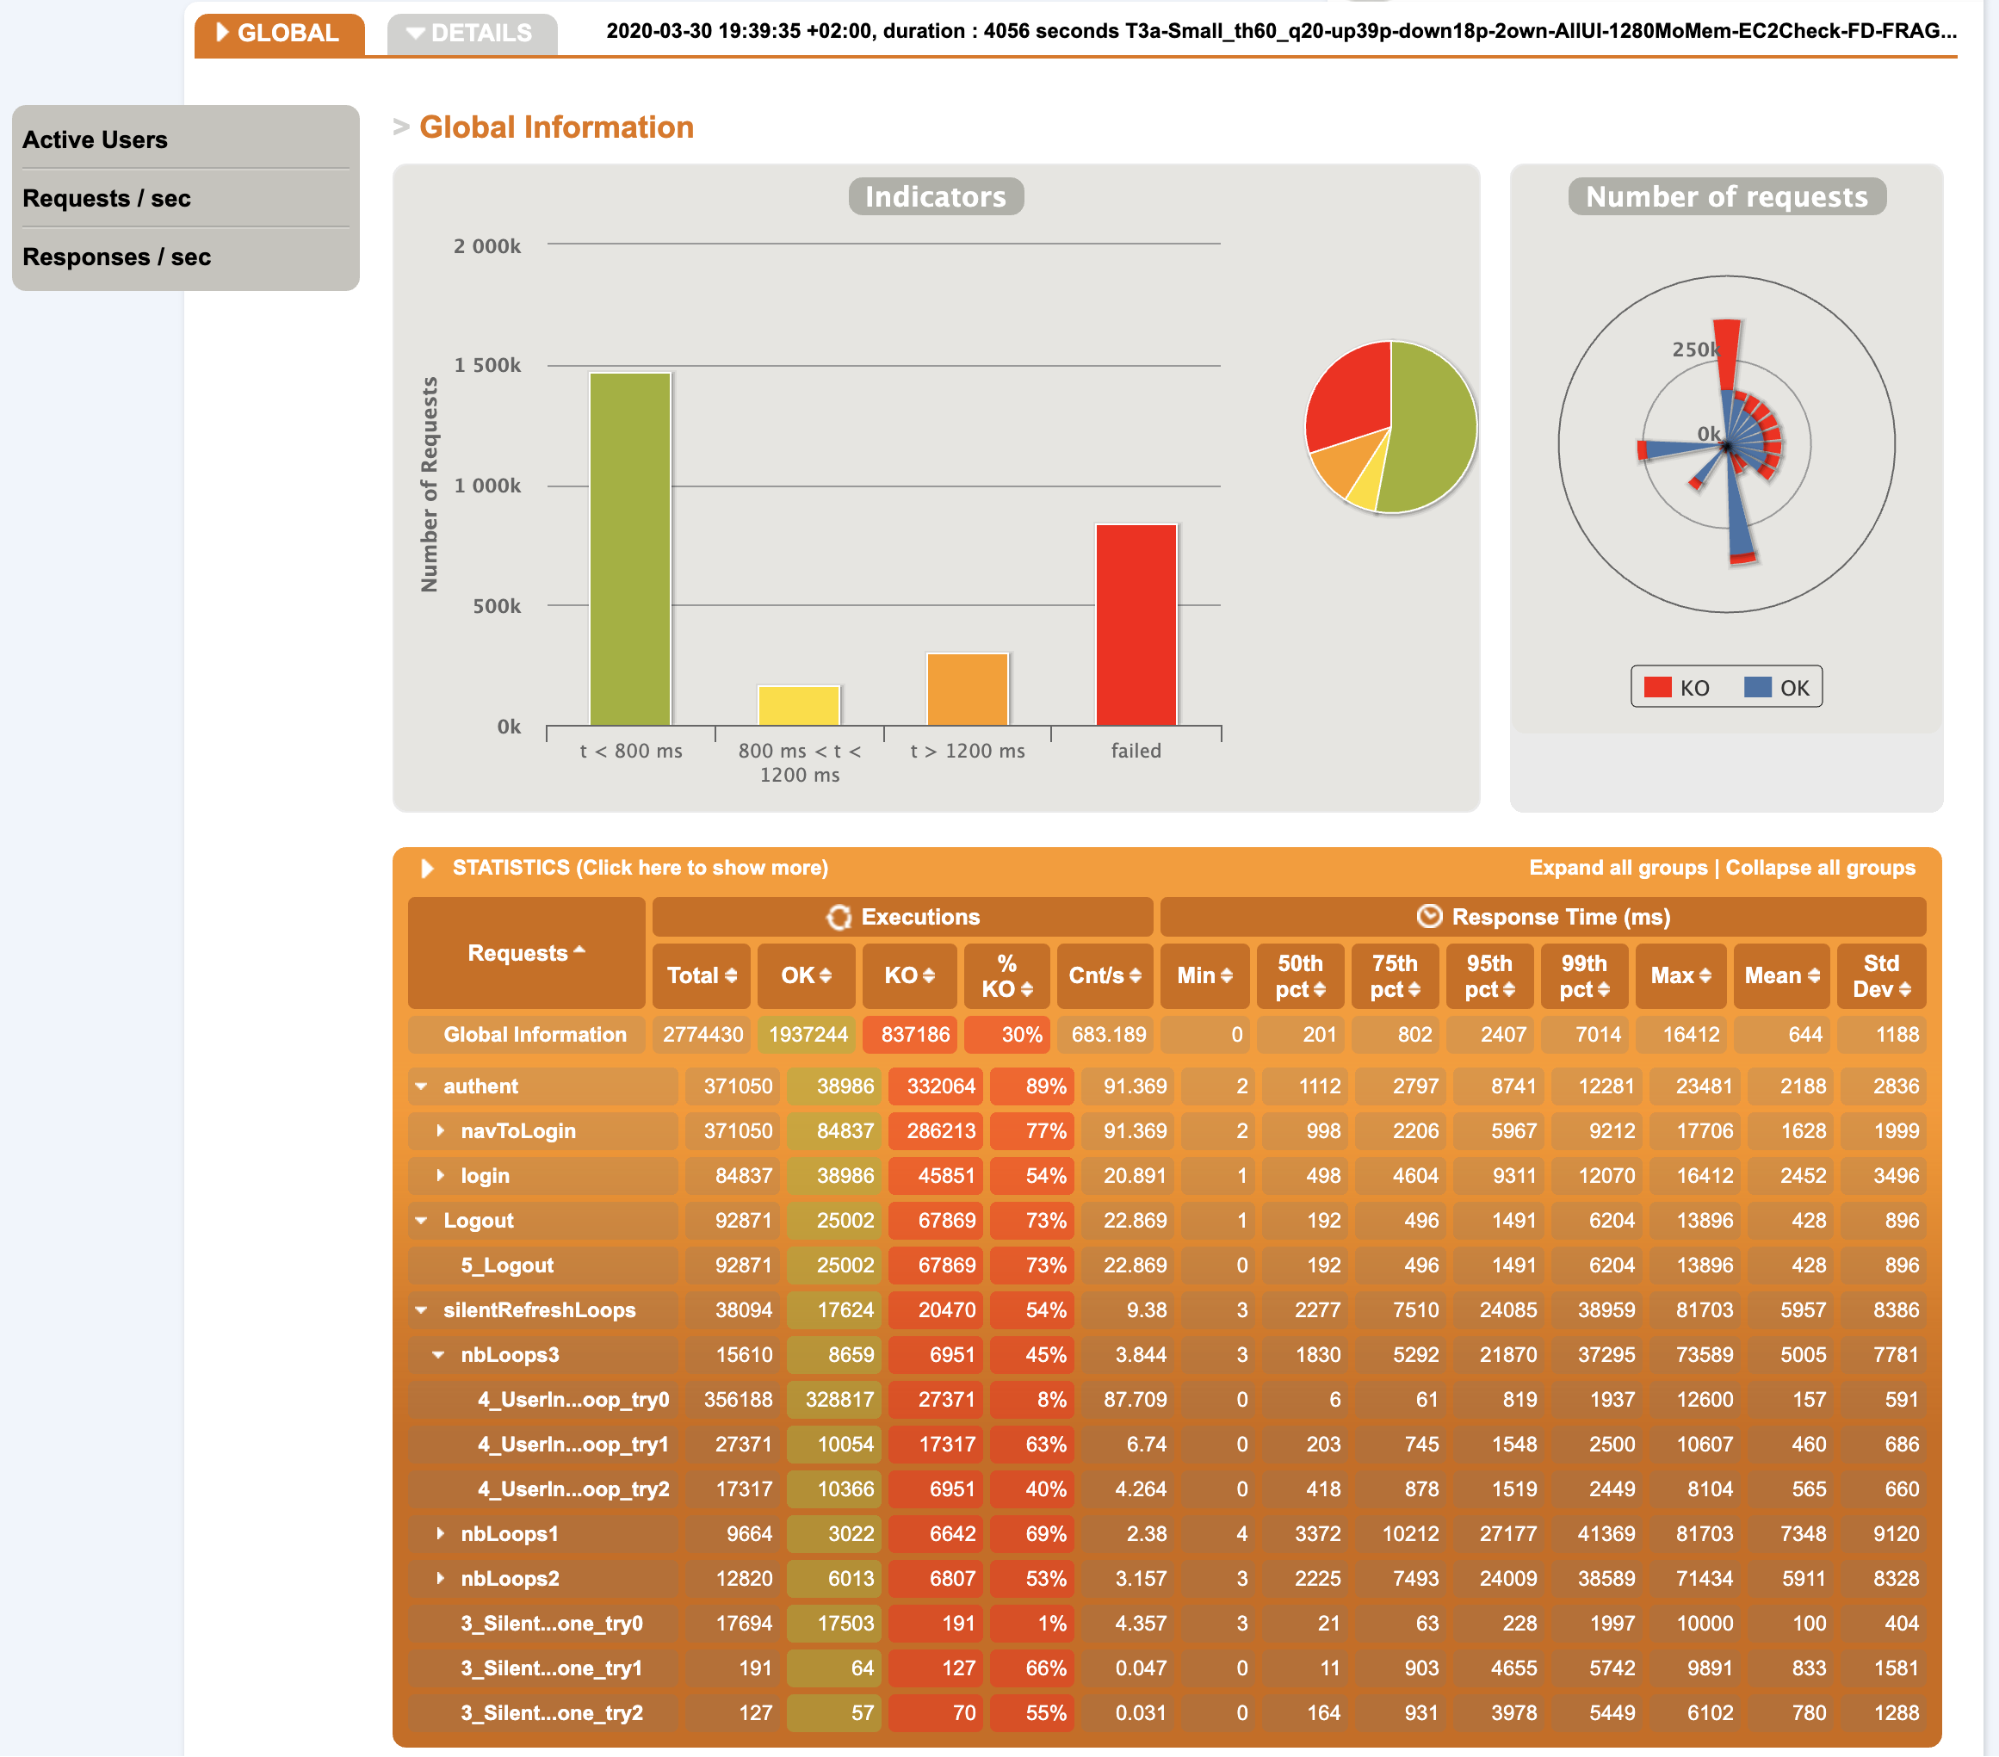
Notes:
- Due to the huge number of errors, the number of executions and the response times are not very relevant, maybe the 50th percentile can be used for correct requests
- We can see a concentration on the login requests
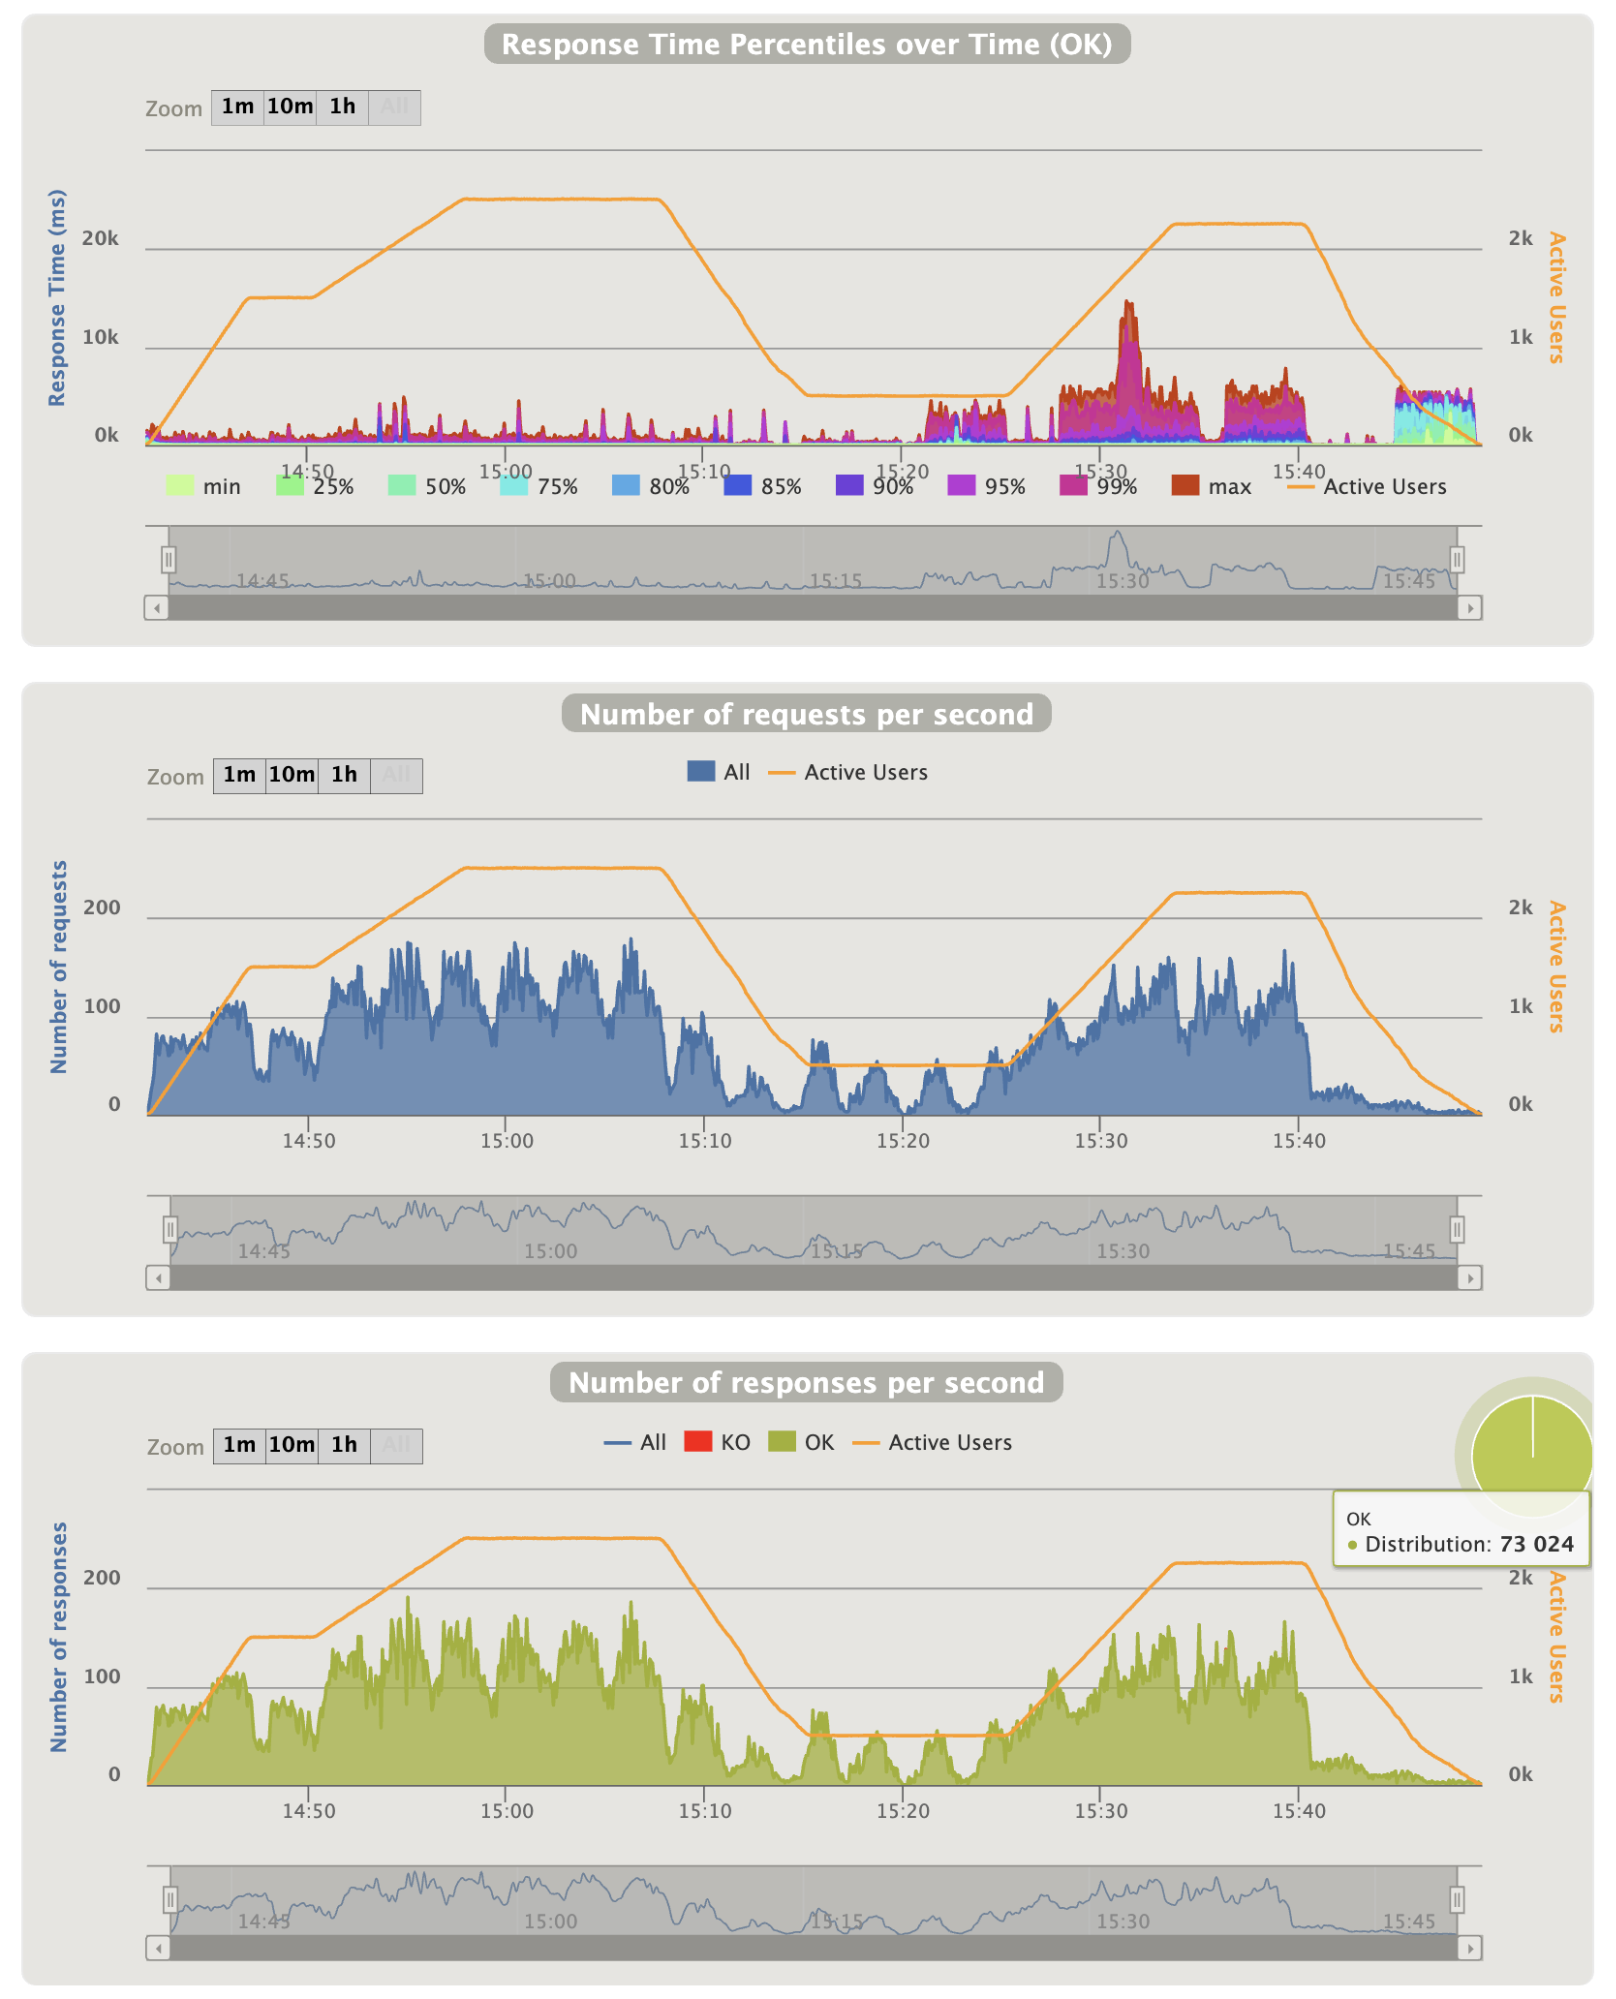
- Overall graphics:
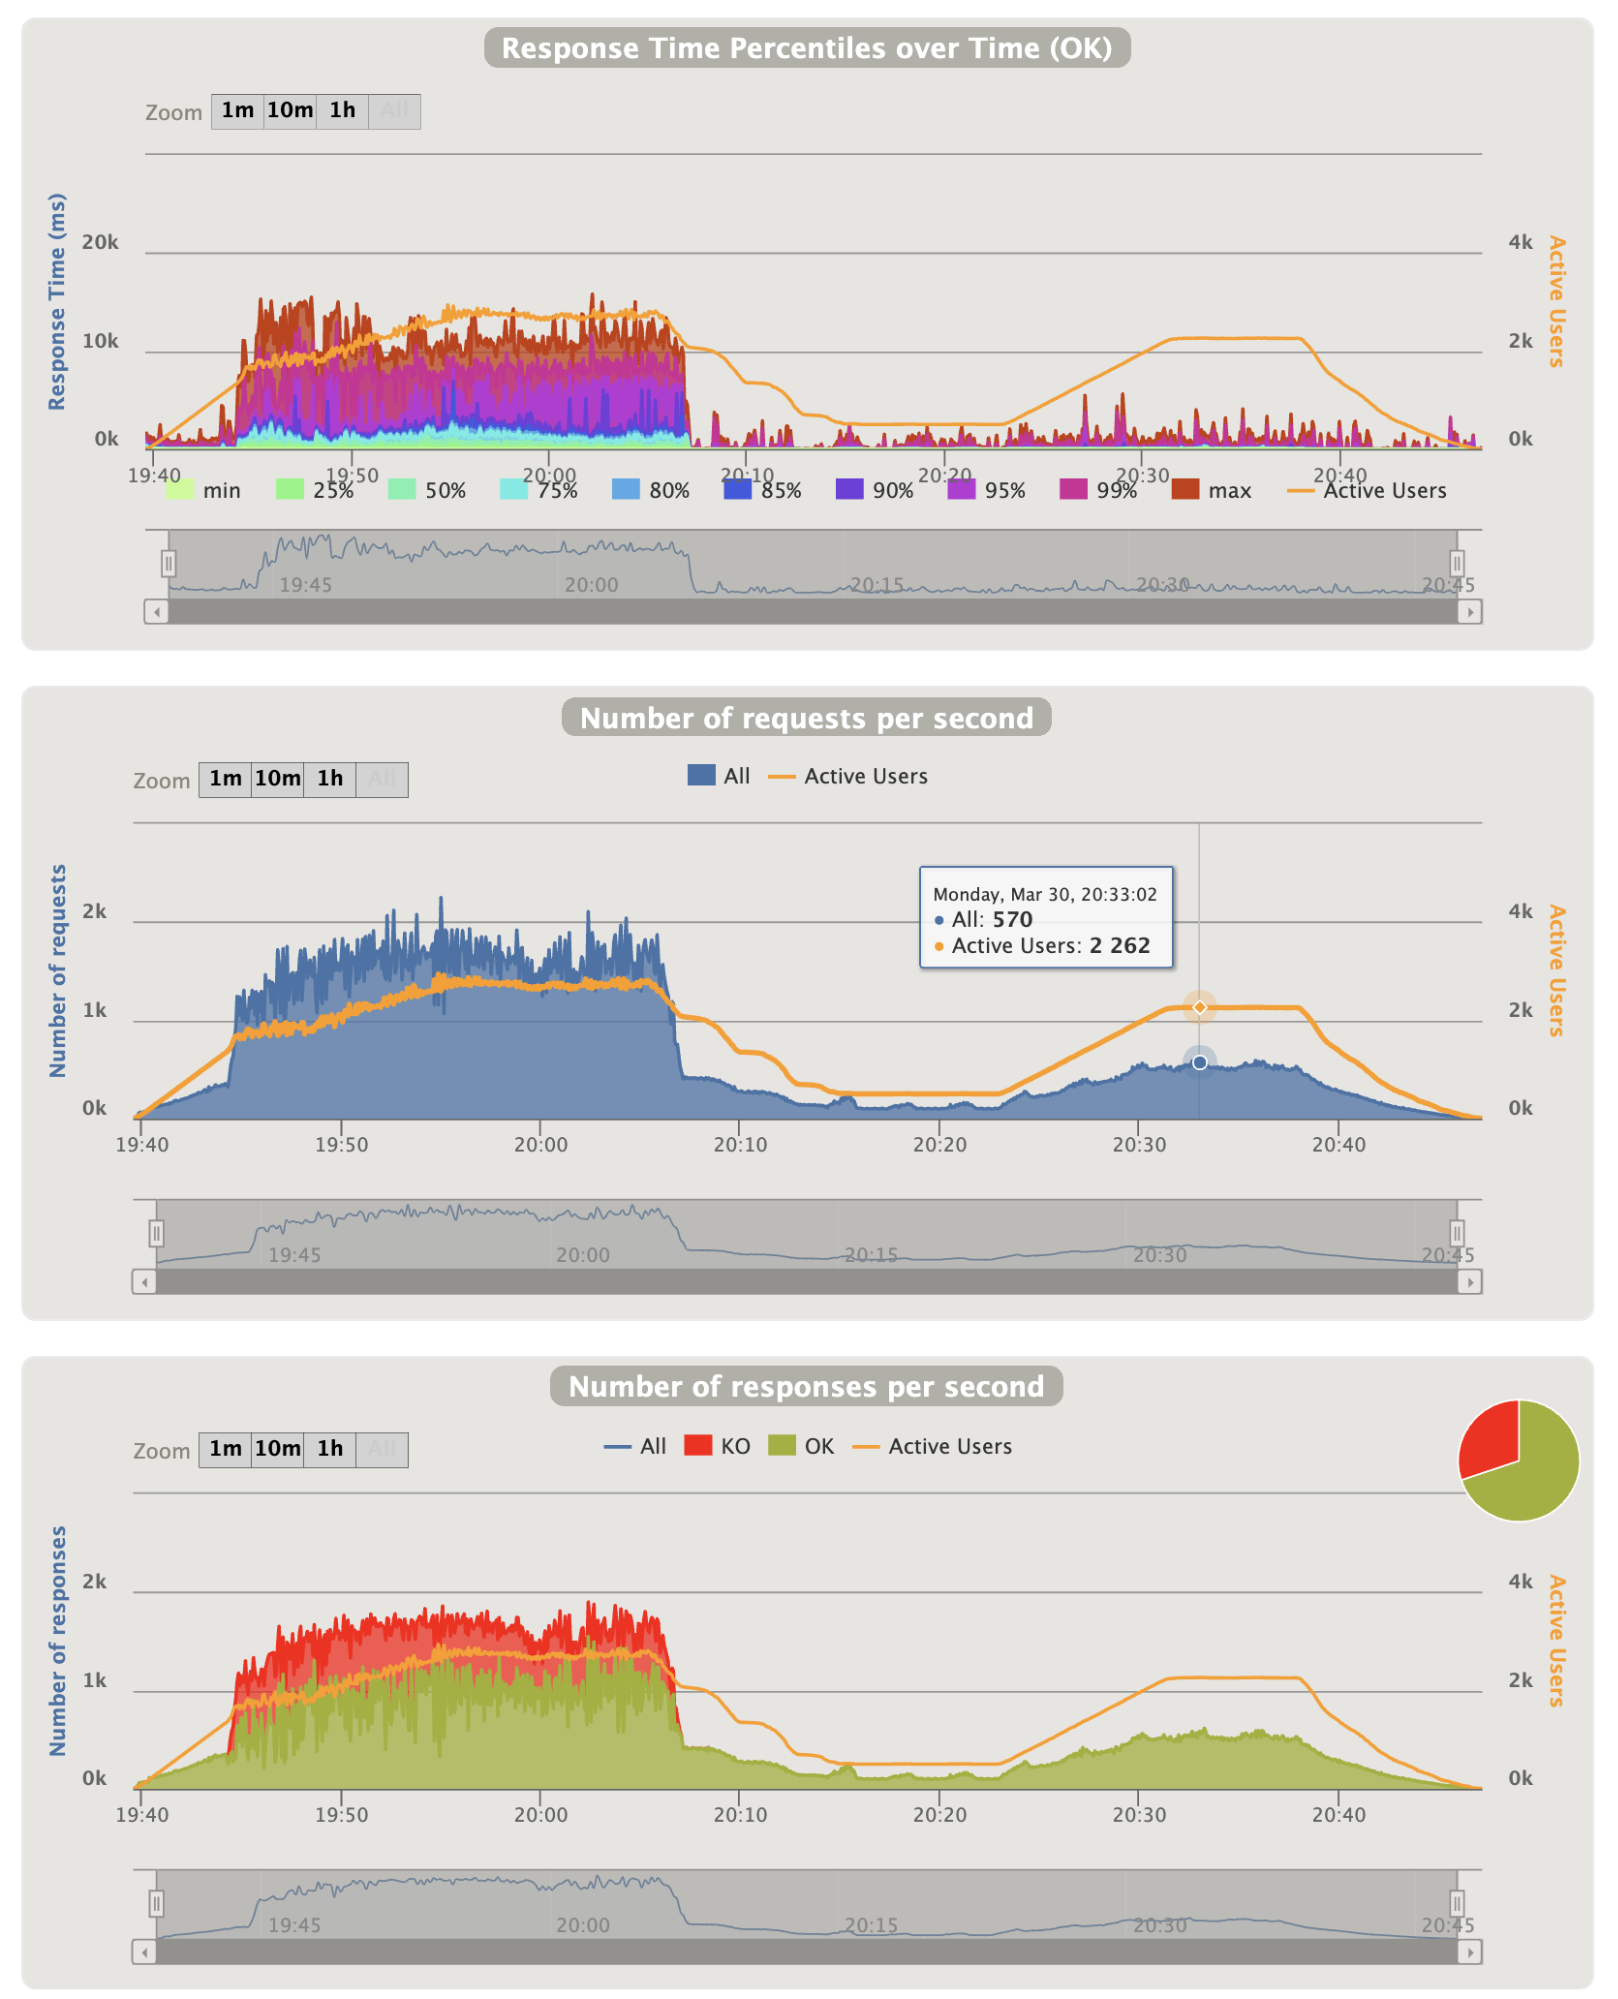
Notes:
- The charts show that Gatling injection is in trouble during the first peak and that a lot of scenarios are renewed constantly
- They also show that they come into trouble at around 19:43 that match to the CPU peek over 70% on CloudWatch metrics
- The first chart shows that 10% of the requests took too long and reached the timeout. Thus, all users end up by being affected by it
- The second chart shows that it can handle 570 requests per seconds on the second peak with normal response time on chart 1 and no errors on chart 2
- Login graphics:
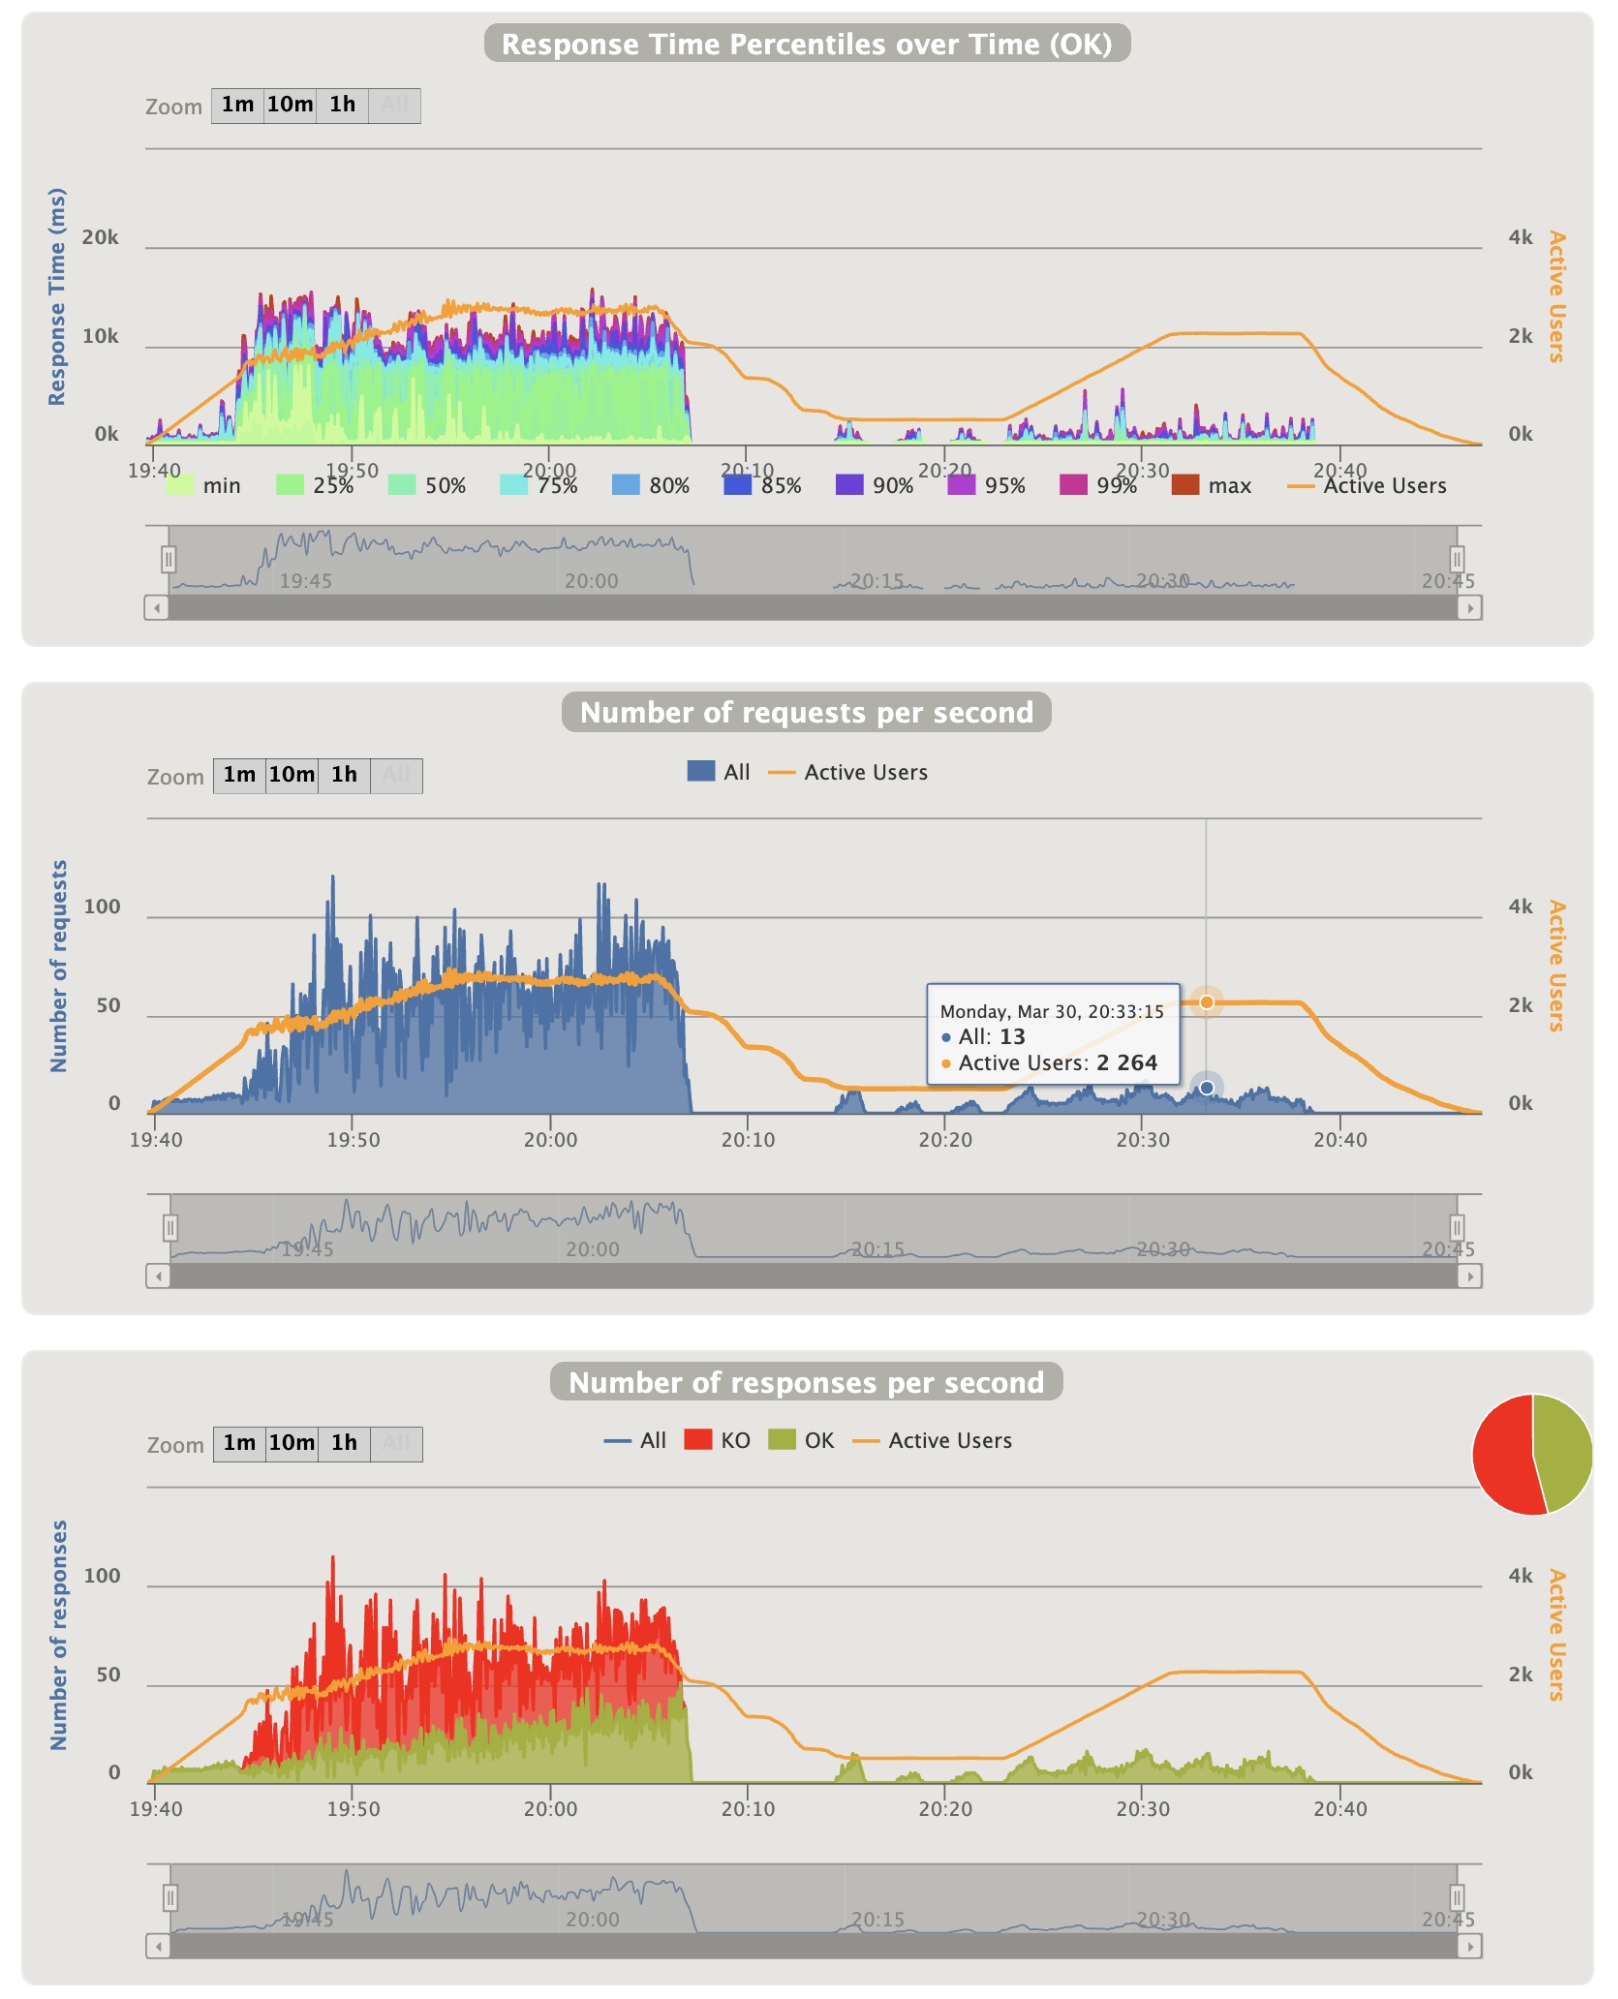
Notes:
- On login charts we see that the number of login is abnormally high (as explain before), nevertheless the OK responses increase according to the healthy instances (at the end of the pike the maximum of 15 is reached)
- 3 instances can handle 8-9 login per seconds (among less important requests) before being overwhelmed
- The gap between 20:08 and 20:14 is normal as we entered the ramp phase to 100 users (indeed, the number of natural end of scenarios is lesser than the number of injected user decrease rate)
Analysis:
As has already been mentioned, the fact is that as soon as a user encounters a problem, the number of logins reaches a very high level as the injector loop is still trying to inject new ones.
What is interesting with this scenario, is that it shows a lot of issues:
- Nodes have difficulties before reaching the max 100% CPU burstable threshold: it seems to be around 60%
- 1 T3a small EC2 instance can handle 2-3 login/seconds
- Our cluster automatically recovers from the trouble phase, responses times and errors met again a normal state
- The cluster, even overwhelmed, carries on responding
- If the cluster is already big enough (15 instances), 13 login/seconds is not a problem during the second pike
- Our Gatling scenario should be improved to realize realistic login retries by increasing spans/pauses and thus avoid the runaway effect
- When an instance has been too much stressed, the CPU gauge does not recover a normal level, we have no explanation on this point (maybe cache overhead), a further analysis of the JMX metrics could have been useful, but we did not have the time to branch a tool like Prometheus on it and the security team did not authorize us to open the management console port even if it was a testing environment.
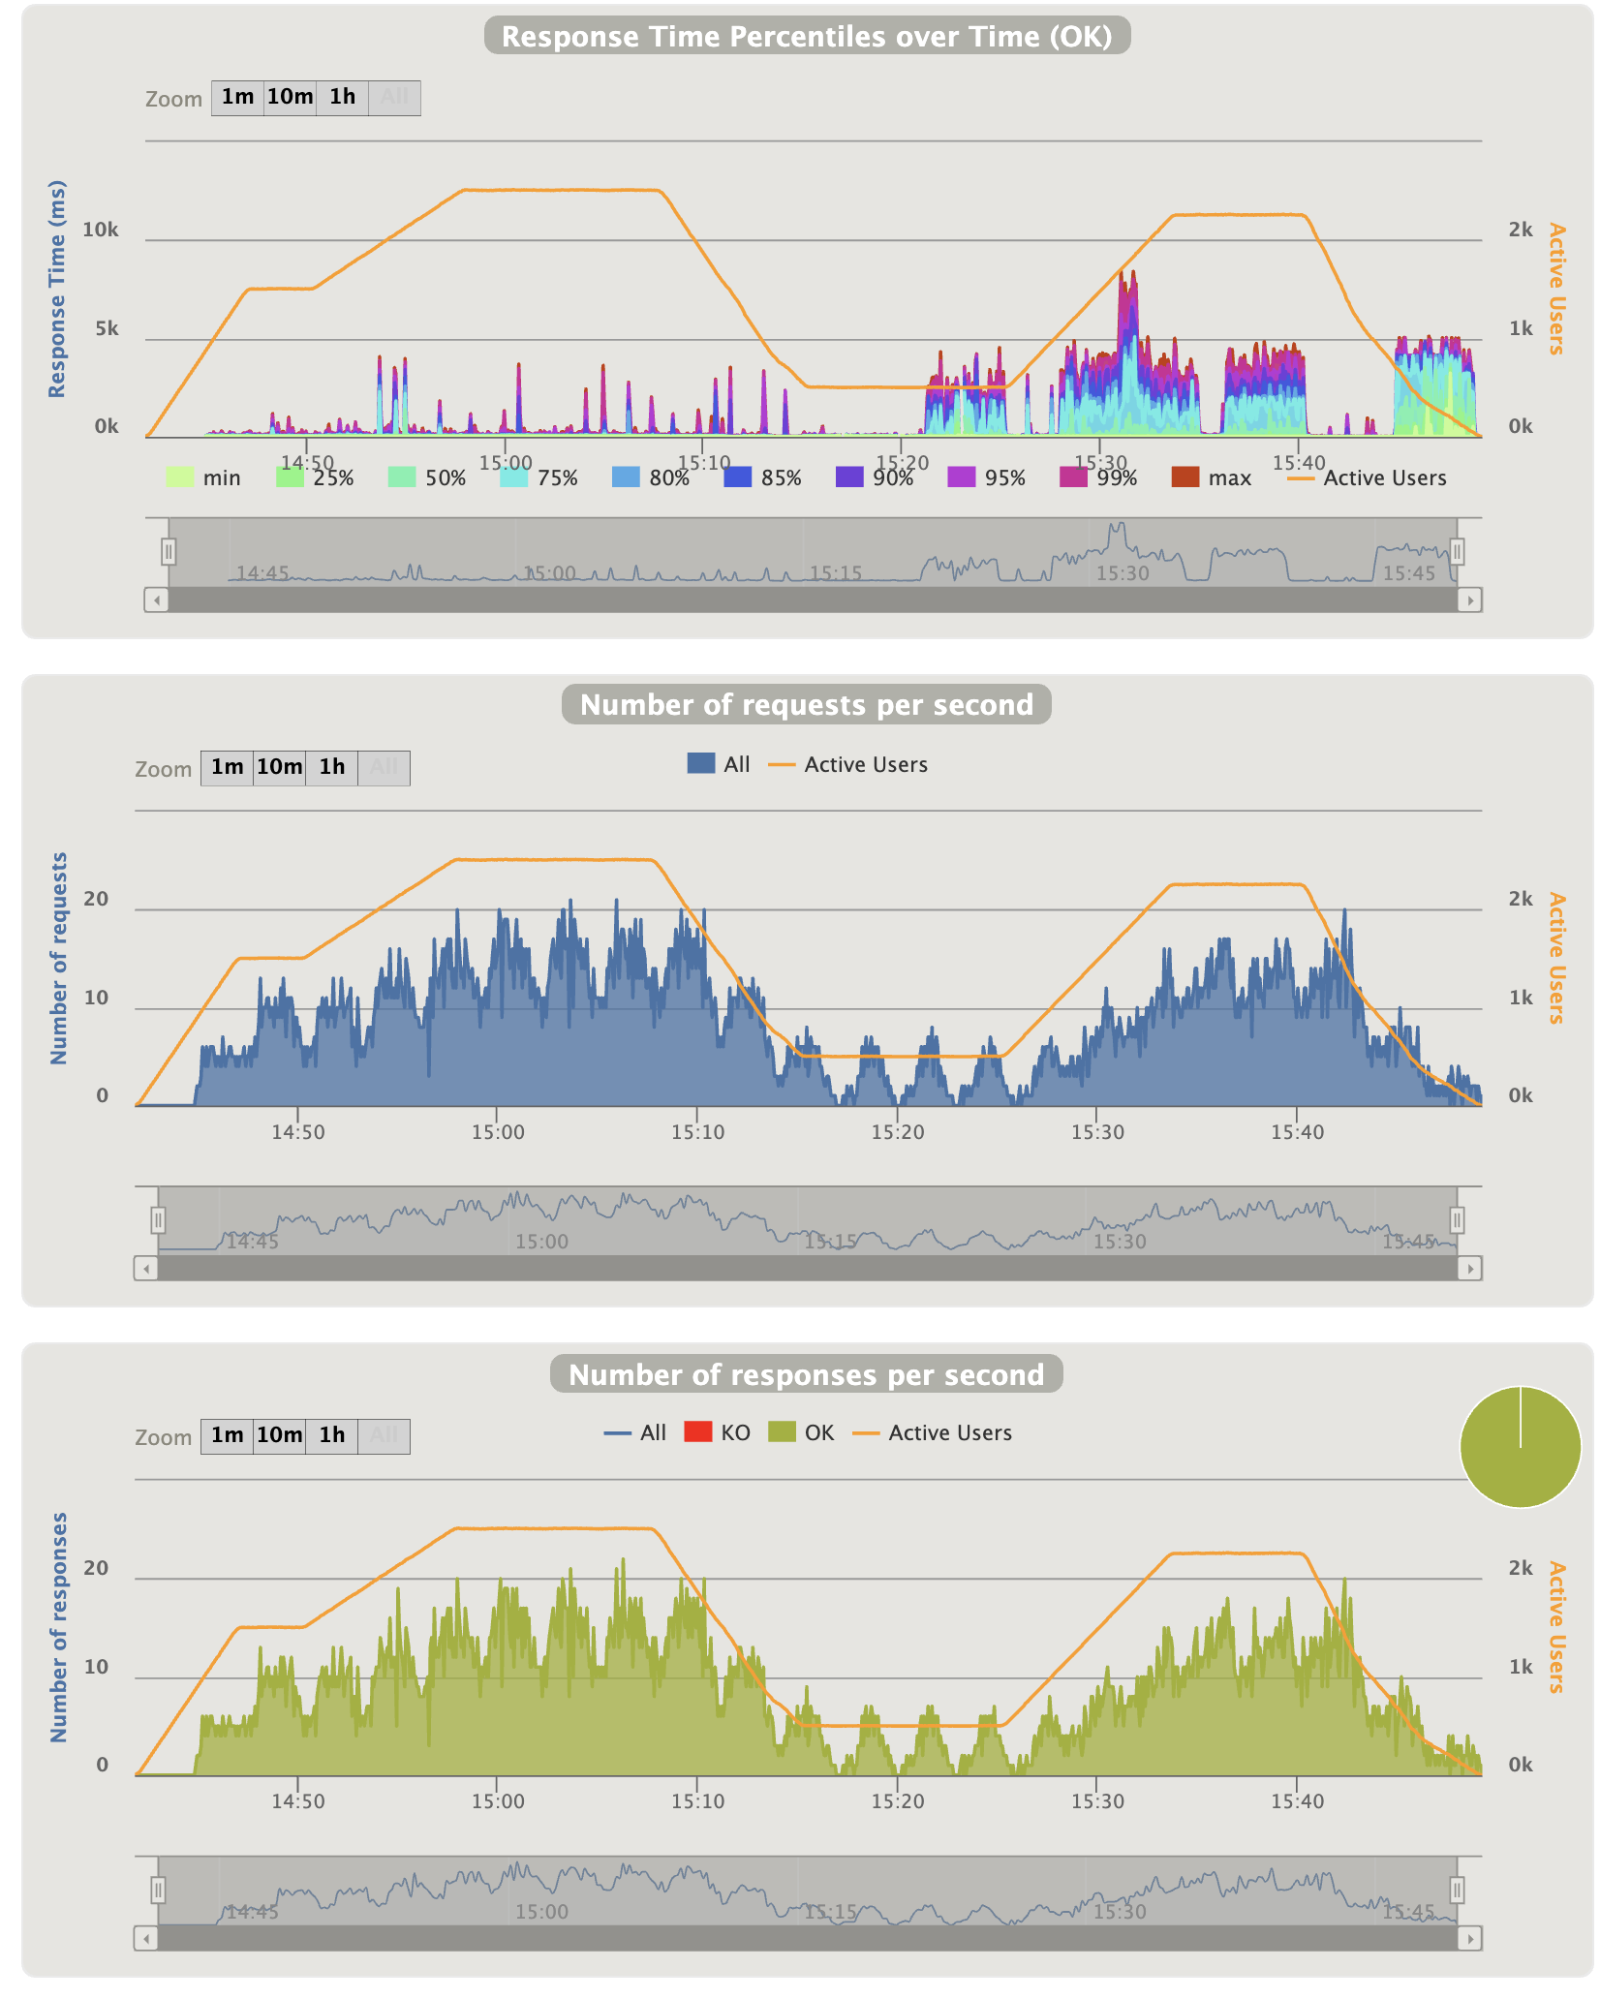
Scenario 2 (One /userinfo request per silent refresh -- cache simulation):
CloudWatch metrics graphics (Sorry for the French labels):
Notes:
- Same observation for the memory, we can also see that it is well freed
- Here we reached 63 connections to the database (still higher than the default maximum one), they are well freed too and there is still no big CPU activity
- CPU gets back to very low rates (<10%) when no solicitation
- CPU burst to 50%, then the constant increasing of the nodes count restrained it well
- Spans with 0% CPU at around: 13:23 (⇾15:23) and 13:47 (⇾15:47)
- The last scale-in ended at 13:47 and it took 10 minutes to get back a normal idle CPU at around 8% level
- There are still some instances that starts in an unhealthy state, but they rapidly recover
- Healthy instance number stopped at 12 and scale-in worked
Gatling reports:
- Overall statistics:
Notes:
- Only 77 KO on 295812 requests
- Response time are OK until 75th percentile
- Most requests are around ~60ms, only login takes 10 times more
- Static resources are very fast to get (NB: another anterior run have shown that it has nearly no impacts on performance)
- We have made ~22000 login in 1 hour that is far from the number we are expecting later
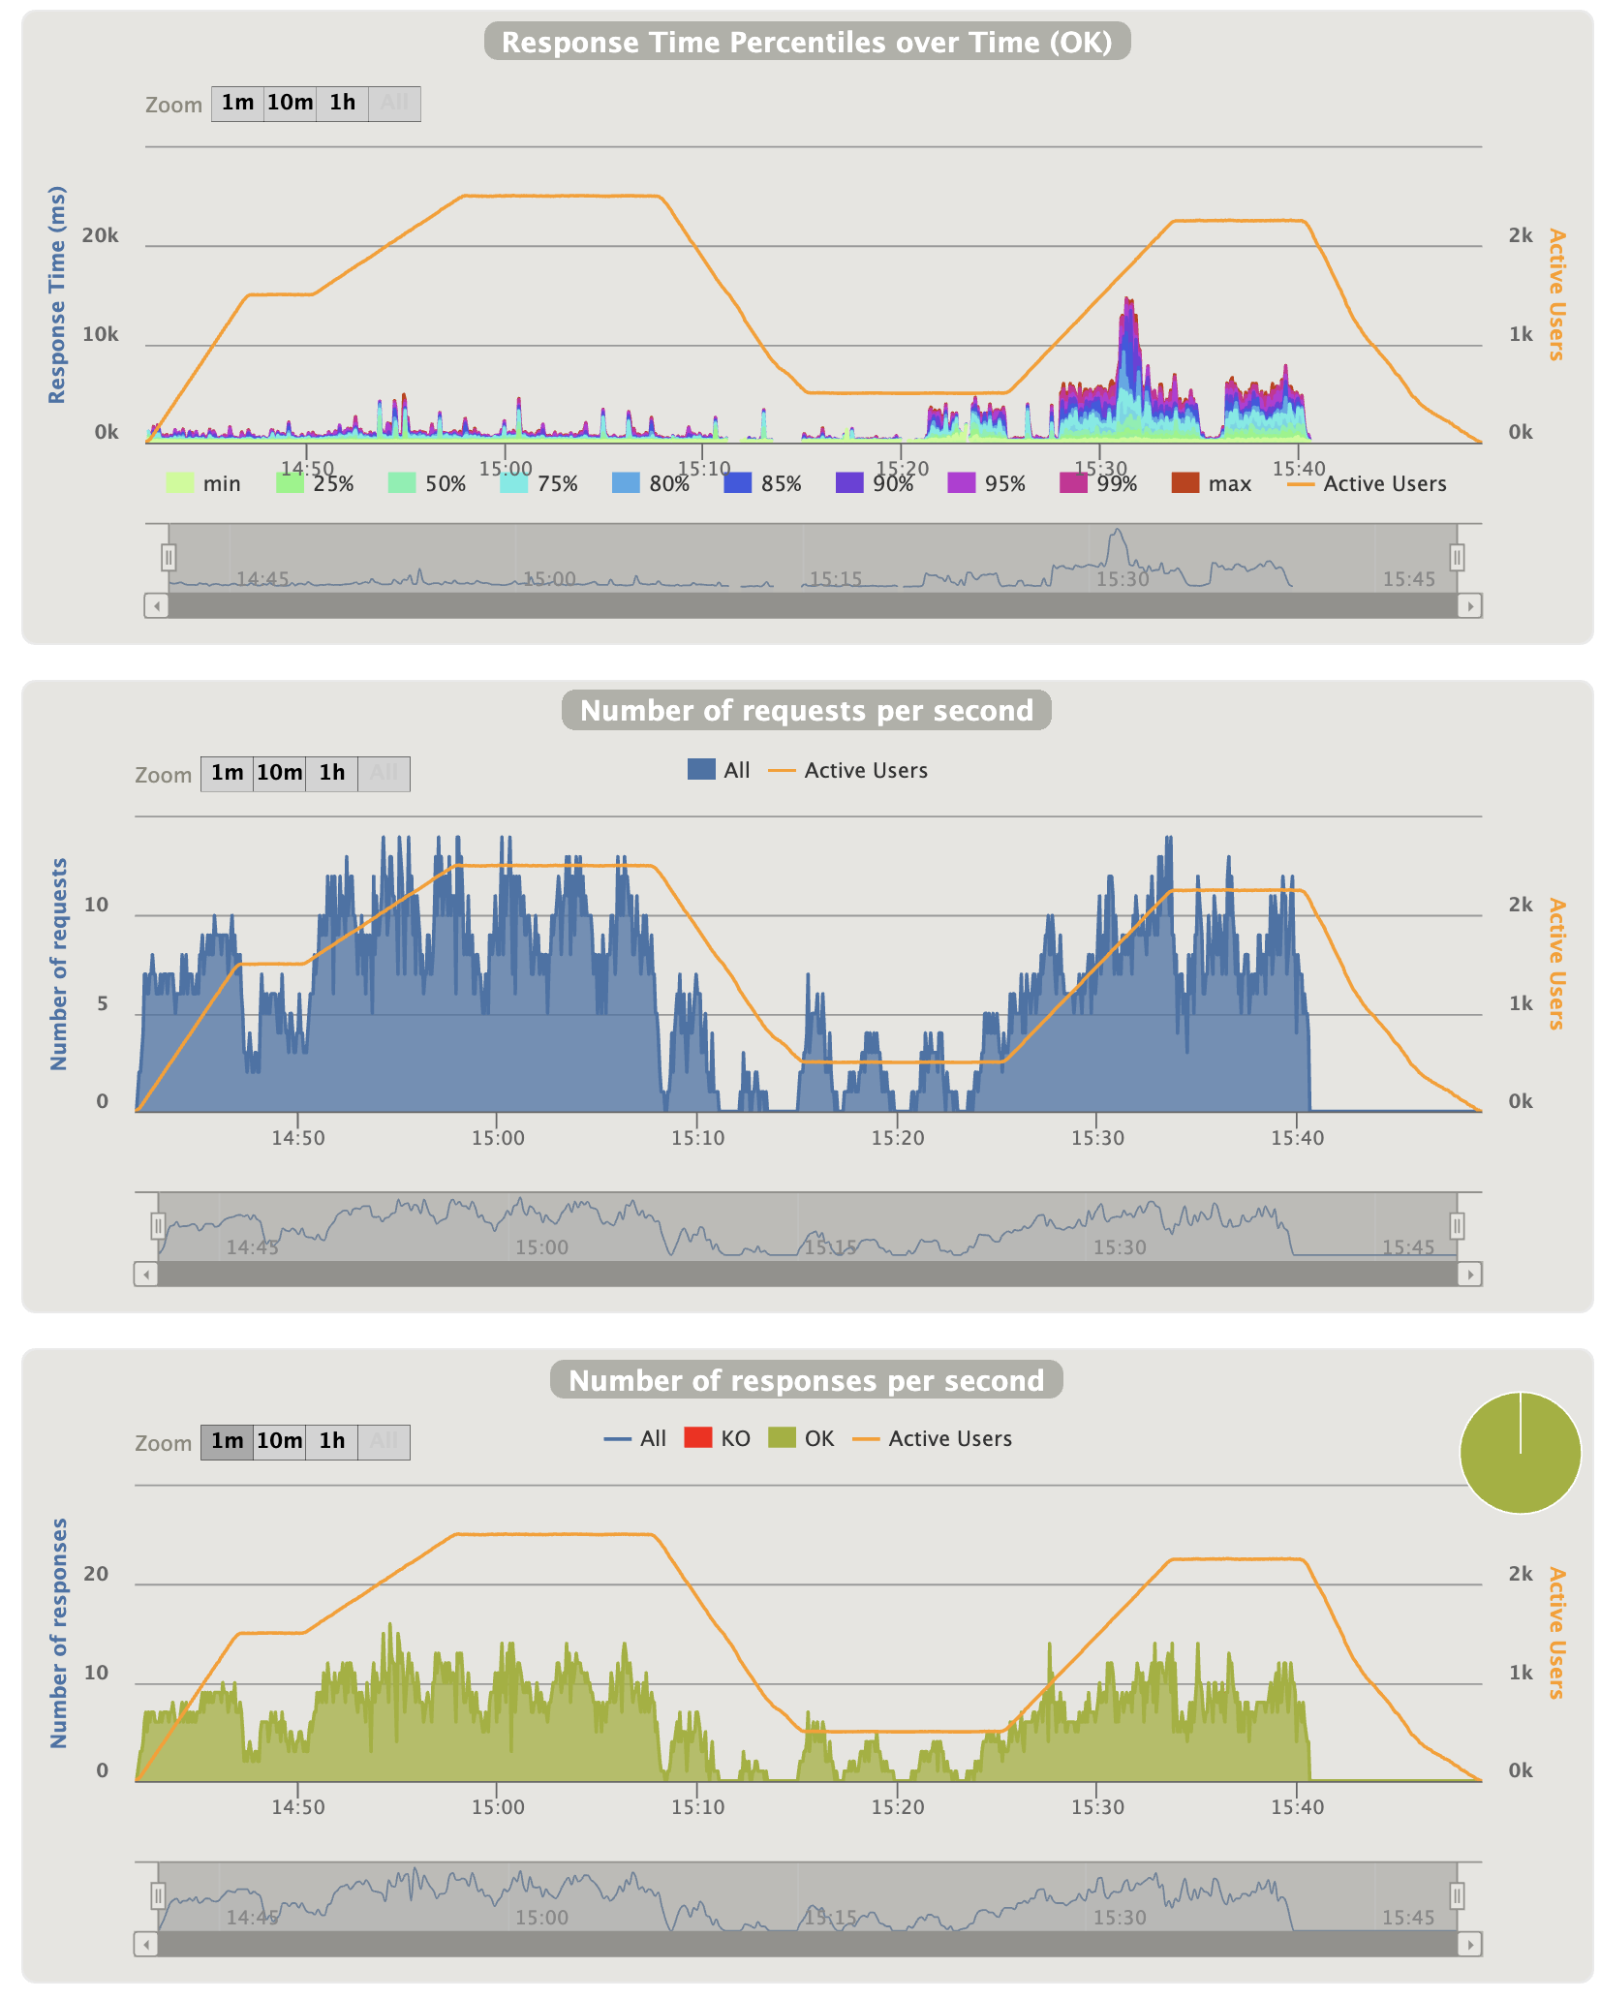
- Overall graphics:
Notes:
- The first part behavior is very good even during the peak
- On the second peak we have around 110 requests/seconds
- On the second part we have areas where the 90th percentile is too high ~5 seconds
- At the end of the last ramp all requests took ~5 seconds, it is a problem
- NB: The run have been made twice and the results are exactly the same : the response times problems are reproducible with the exact same intervals
- Login graphics:
Notes:
- Not so much thing to say except that the 90th percentile problems seems to match with the login requests
- Silent refresh graphics:
Notes:
- Not so much thing to say too, except that the 90th percentile problems seems to match as well with the silent refresh requests
- The last big area problem is corresponding only to the silent refresh requests (all the others types of requests are finished)
Analysis:
The first part of the run is fine, if the injection slope is not too steep, the instance burst works perfectly and response times are really great.
For the second part, although the load peak has not started yet, it presents some problems starting with 500 users. The first scale-in has started at 15:15, we know that it is scale-in that creates the problems but it does not harm until the 3rd instance downscale. What is weird is that the first area and mainly the last one, exactly match with the CPU span of 0%, maybe it could be a lock on the cache synchronization. By lack of time and no JMX access we were unable to find the reason for this, maybe we could have also tried less aggressive scale-in with a bigger cooldown.
Another information to keep in mind is that after a short period when the threshold of the minimum number instance is reached, everything is fine again and another run can be launched without the response time issues.
Comparison and projection:
If we compare this scenario with the last one, it shows that adding a cache on /userinfo requests really helps when the ramp is steep. So, adding a cache is probably a good thing to consider.
The second part of the first scenario shows that even with 15 instances, the response time is fine: having many nodes does not seem to create caches synchronization overhead.
For our future needs we would not need to handle so much requests, thus the number of instances would probably not reach more than 5 instances.
In Ireland the cost for one T3a small instance is about 0,0204 USD per hour without additional burst credit (suppose a fine-tuning with real users). Working times are around 12 hours, so if we have 10 instances the whole day, and we force scale-in at the end of it to the minimum (3 instances), we will have a total of (12 * 10 + 3 * 12) * 31 * 0,0204 ~ $100 per month. By disabling automatic scale-in, we will invest maybe $30-$40 more per month but the solution will still work. When we compare the cost of the databases etc., it is not such a big deal.
Conclusion
We have seen that it is not so easy to find an acceptable solution for auto-scaling Keycloak instances on a Cloud provider. In our use case, we were dealing with EC2 instances and not Docker containers but the approach is nearly the same. I am pretty sure that we will have been confronted to the main same problems and so, whatever provider we use.
What we can state so far is that Keycloak is a very good product, but if you have to consider running it with a lot of users, you should not neglect the amount of work to configure it.
We were able to build a Keycloak cluster with the Cloud constraints of using TCP protocol, but making it fully auto-scalable was not utterly conclusive. We started to keep scaling-out automatically but the scale-in is done once at the end of the day. The additional costs are not so important. If you are expecting very huge peaks like on e-commerce websites, thus, the number of nodes needed between those peaks and the normal periods will be significant and will lead to a lot of resource waste if we do not scale-in.
However, you should compare the cost of paying licenced products or paying unneeded resources that are not necessarily very expensive.
The Quarkus team seems to have started a Keycloak X project that would probably ease Cloud deployments, so keep an eye on it!
We may have potentially missed many things, but I hope that the approach used in this article will help you.
If you have survived until here, do not hesitate to enlighten others by adding comments below and share your own experience.


Comments