As part of my journey to learn more about blockchain, I discovered I had a growing desire to visualize what was happening on the blockchain. I'm quite comfortable in the terminal; however, it's not always the most visually efficient way to interpret something. Not to mention it can be quite exciting to see things happening on a fancy UI!
Here are the steps:
- Setup
- Download and Install Tools
- Configure the Node Monitoring App
- Start the Node App
- Start the Frontend
- Explore the Dashboard
Preface
This post will go over 2 tools that work together to visualize various stats and information about the blockchain:
This is the backend service that runs alongside eth-netstats. This tool will be used to configure the node app. All the configuration and setup for monitoring a node on the Ethereum blockchain is done in this API.
This is the frontend portion that provides a UI to visualize several technical components and information about the blockchain. You can view the public Ethereum blockchain using this dashboard here. In fact, you can even link your own Ethereum node to this tool and contribute to the other nodes providing updates about the public blockchain.
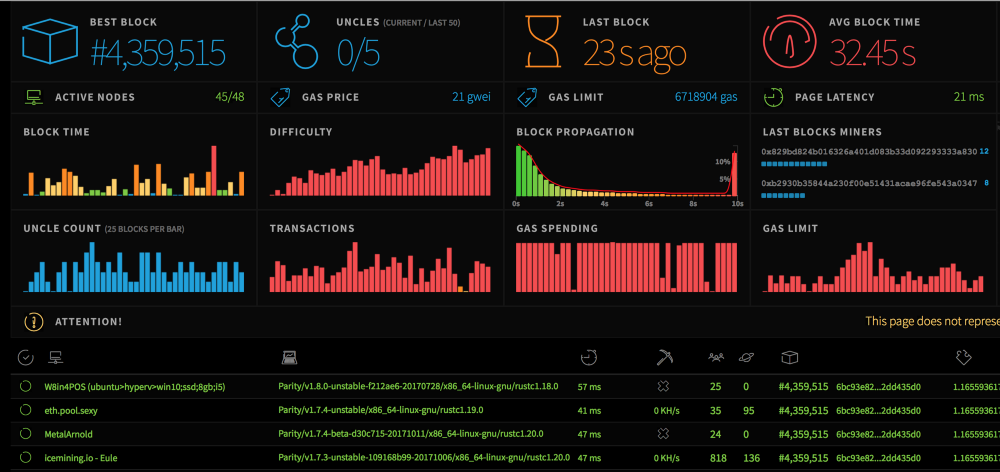
Snapshot of the public Ethereum network stats.
1. The Setup
Before we can begin to play with the monitoring, we must take some steps to set up a private network. Take this opportunity to create a private network containing 5 nodes. If you are unfamiliar with how to do this, please refer to my previous blog, A Journey into Blockchain: Private Network with Ethereum for a step-by-step guide. The folder structure looks like the following:
~/private_network $ ls
genesis_file.json node01/ node02/ node03/ node04/ node05/
2. Download and Install the Tools
At this point, we're ready to download the tools that will be used to monitor the private network, or in other words, clone the repositories. Be sure to keep these repositories in an easily accessible place (i.e. NOT in one of the node directories).
To clone eth-netstats, run the following command:
git clone https://github.com/cubedro/eth-netstats.git
Now we'll need to install eth-netstats. Make sure you are in the eth-netstats directory then run the following commands:
$ npm install
$ sudo npm install -g grunt-cli
$ grunt
To clone eth-net-intelligence-api, run the following command:
$ git clone https://github.com/cubedro/eth-net-intelligence-api.git`
There are no specific installation instructions for this tool; however, make sure everything is up to date. I have run into a few problems getting things to work properly only to discover that a few quick updates did the trick. We'll configure the node app in the next section.
3. Configure the Node Monitoring App
Now we're ready to configure the node monitoring app to monitor the private network that we previously setup. To do this we'll need to modify the app.json file located in the eth-net-intelligence-api directory:
[
  {
    "name"              : "my_private_network",
    "script"            : "app.js",
    "log_date_format"   : "YYYY-MM-DD HH:mm Z",
    "merge_logs"        : false,
    "watch"             : false,
    "max_restarts"      : 10,
    "exec_interpreter"  : "node",
    "exec_mode"         : "fork_mode",
    "env":
    {
      "NODE_ENV"        : "production",
      "RPC_HOST"        : "localhost",
      "RPC_PORT"        : "8000",
      "LISTENING_PORT"  : "30303",
      "INSTANCE_NAME"   : "node01",
      "CONTACT_DETAILS" : "",
      "WS_SERVER"       : "http://localhost:3000",
      "WS_SECRET"       : "test",
      "VERBOSITY"       : 3
    }
  }
]
There are few configurations that need to be changed in this file:
"name": The name that will appear for your node app in thepm2process manager (see next section for more details onpm2)"RPC_HOST": The IP address for the machine hosting your runninggethinstance"RPC_PORT": The RPC port that yourgethinstance is running on"LISTENING_PORT": The network listening port for yourgethinstance"INSTANCE_NAME": The name that will appear on the dashboard in your browser for this particular node"WS_SERVER": The server address for the frontend UI (i.e.eth-netstats) running in background"WS_SECRET": The secret used to connect the frontend and backend tools (i.e.eth-netstatsandeth-net-intelligence-api). You choose any value to put here.
4. Start The Node App
Now that the node app has been configured, it can be started. The backend tool eth-net-intelligence-api uses a node production process manager called PM2. Most, if not all, of the commands used to interact with the backend node app will begin with pm2.
First, cd into the eth-net-intelligence-api directory. Once in this directory, run the command:
$ pm2 start app.json

Starting the node app, ‘app.json'.
The backend is now running. Commands pm2 show <id>, pm2 logs, and pm2 list are helpful commands for debugging and general monitoring of your node apps with pm2. For more details use pm2 --help.
5. Start the Frontend
Now that the backend node app is running, the frontend can be started. In a separate terminal window cd into the eth-netstats directory. Recall that the WS_SERVER and WS_SECRET configurations were set previously in the app.json file used to run the backend app. Therefore, the secret must be passed to the frontend as follows:
WS_SECRET=test npm start
Now visit http://localhost:3000 in your web browser. You'll notice that no nodes are listed in the monitoring dashboard. That is because no instance of of geth is currently running. In a third terminal window start an instance of geth. If you're unfamiliar with how to do this refer to my previous blog section 5. Hint, the command should look something like this:
$ geth --identity "node01" --rpc --rpcport "8000" --rpccorsdomain "*" --datadir "./node01" --port "30303" --nodiscover --rpcapi "db,eth,net,web3,personal,miner,admin" --networkid 1900 --nat "any"
After the geth instance has been started, refresh the Ethereum Network Status webpage. The node should now be listed on the dashboard.
6. Explore the Dashboard
Now that everything is setup and the monitoring is running, the fun begins. First let's add in the rest of the private network that was created in the beginning. If you recall, there are a total of 5 nodes. With node01 still running, start node02 and node03. Attach these 2 nodes to node01 using the command admin.addPeer(<node01 enode address>). Refresh the dashboard, you should see the 2 peers appear for node01.

Attaching ‘node01' and ‘node02' to ‘node01'.
Now lets add node04 and node05 to the dashboard. In order to do this we'll need to create a couple new configuration files. Copy app.json and create 2 new files: app04.json, and app05.json. They can be named whatever you want but, to avoid confusion we'll match the numbering with the nodes that they'll be tracking. Only 4 configuration fields will need to be changed:
"name": To avoid confusion, give a name specific to this node (e.g.my_private_network_node04).RPC_PORT: Change to reflect the RPC port used bynode04ornode05(e.g.8003).LISTENING_PORT: Change to reflect the listening port used bynode04ornode05(e.g.30306).INSTANCE_NAME: Give a unique name specific tonode04ornode05.
Start theses 2 new node apps with:
$ pm2 start app04.json app05.json
Start the geth instance for node04 and node05 and refresh the dashboard.

node04 and node05 now appear on the dashboard.
Now the entire private network that was previously setup is being monitored on the dashboard! However, nothing is actually happening. Thats because none of the nodes are actually mining. Start a miner on node02. Notice that node02 is not shown mining despite being attached to node01. This is because the backend node app, app.json is connected to the ports for node01 NOT for node02. However, node01 is updating with the blocks that are being mined on node02. Additionally, you'll notice that node04 and node05 are NOT updating with the latest blocks. Recall that node02 and node03 were connected to node01 but, node04 and node05 were never connected and remain independent at this point.
To complete the private network, connect node04 to node01 and connect node05 to node04. The network connection diagram is shown below: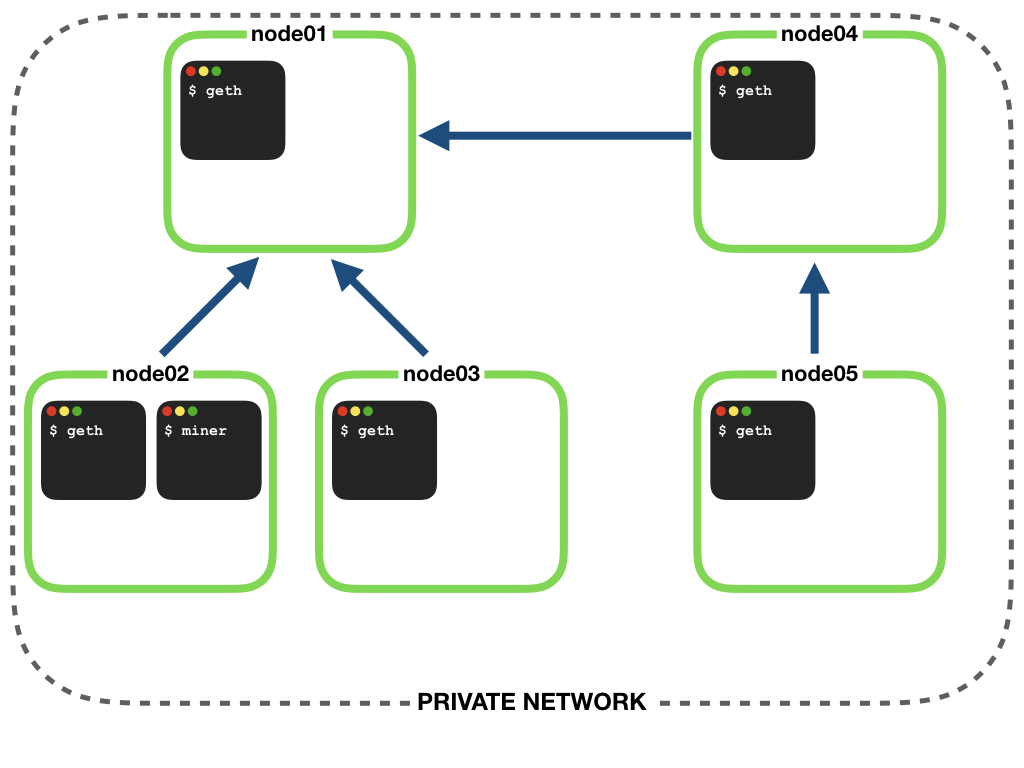
Diagram of the private network shows the node connections.
After making these final node connections you'll notice that all the nodes will update to display the same last block. You may also observe that it takes node05 a bit longer to sync up with the rest of the network. This is because there are 3 degrees of separation between node05 and the mining node, node02.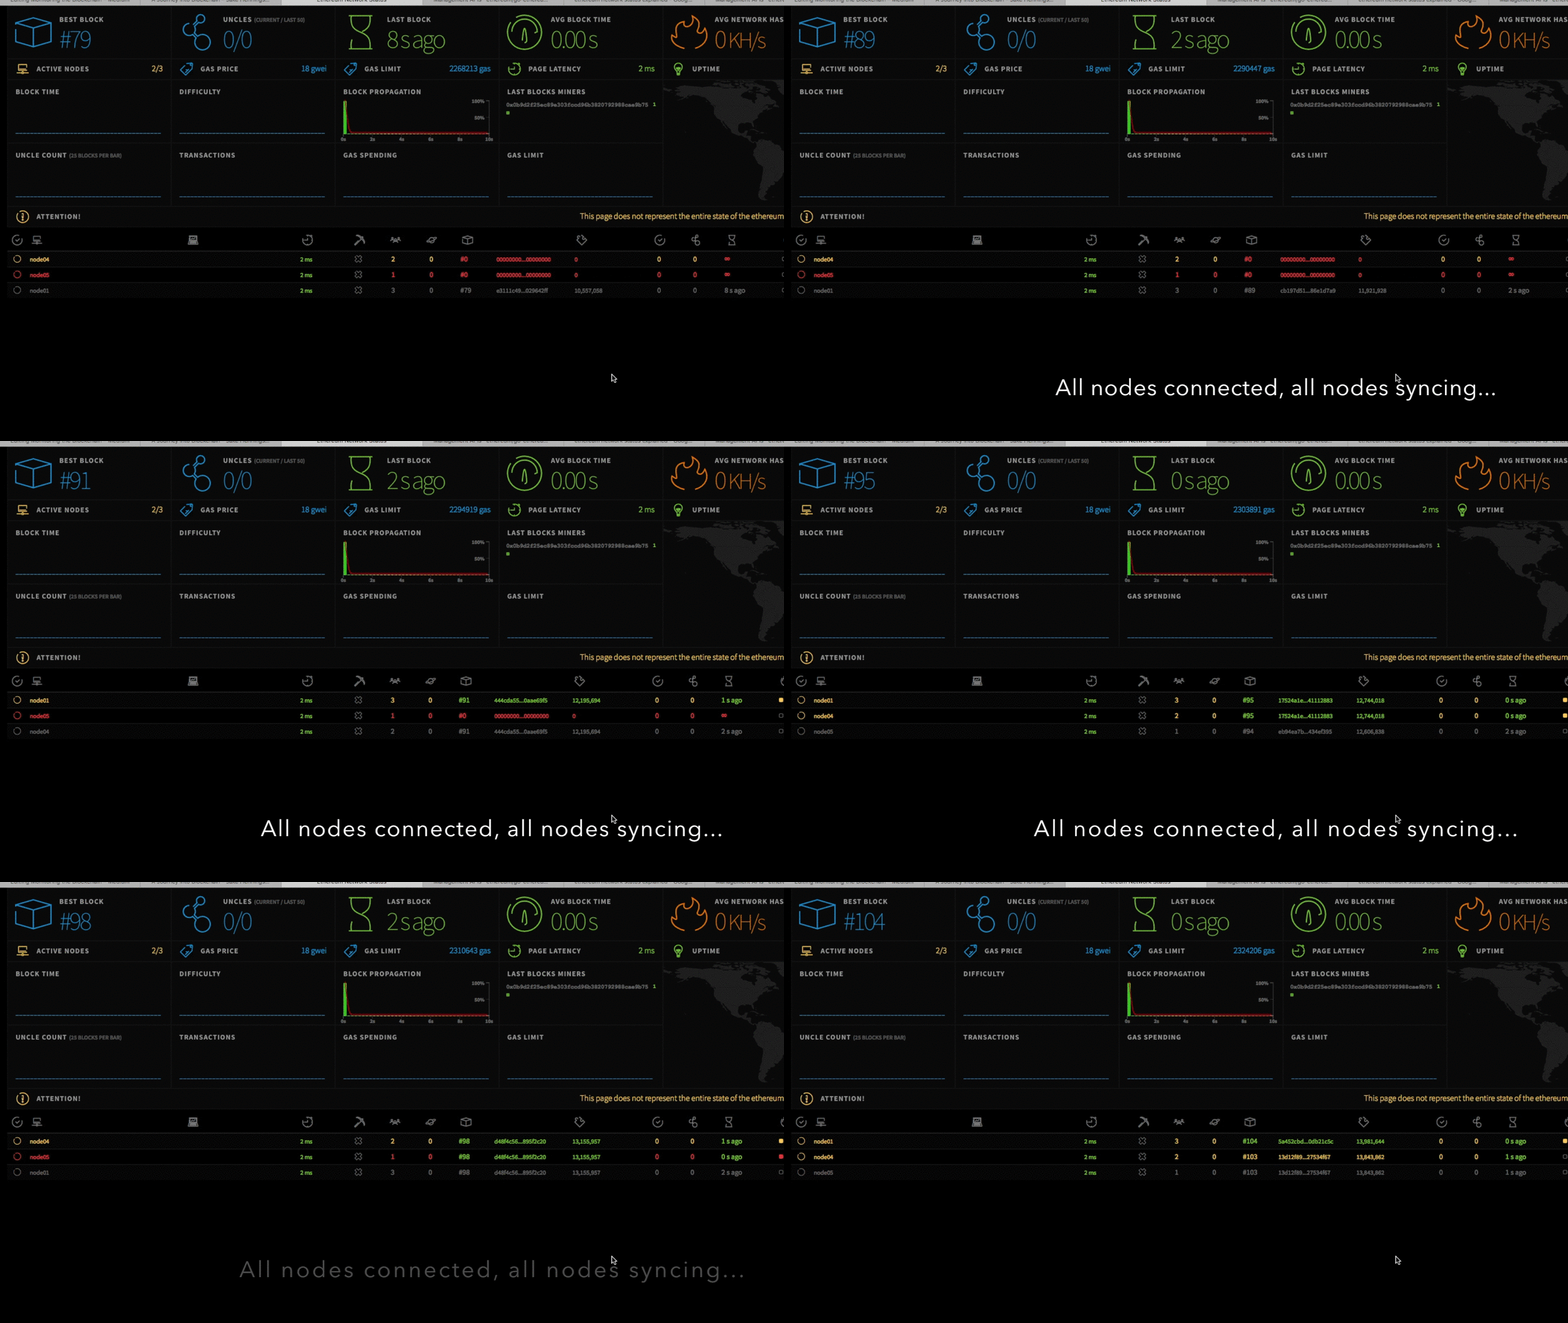
Monitoring the entire private network.
You may notice that there are several different statistics, graphs, and other performance metrics captured in this dashboard. To discover what everything on the dashboard means, watch this video:
Conclusion
After spending a fair amount of time experimenting with the blockchain I was compelled to find a way to better monitor the networks I was creating. Ethereum Network Stats provides a great way to gain a feel for how a Ethereum blockchain is operating.
Explore some more...
- Can you add some more nodes to you network and monitor them on the dashboard?
- What happens if you create a node app for
node02? Are you provided with any more information about mining activity that you weren't before?



Comments