
Last time, we took a look at Plotting Points on Two Axes using D3.js; now let's take a look at how to integrate it with React.JS! Whether you're adding a D3.js graph to an existing React.js application, or want to add a responsive UI to your D3.js graph, the following example will show you how to have both doing what they do best.
Remember: React gathers the data, and D3 displays it.
Setup
- Grab the source code from the following link.
- After either downloading it as a zip or cloning it, use the following command in that directory to download the needed node_modules packages:
npm install- If you don't have npm installed, you can install it using these instructions.
- If it complains about permissions, try this command instead:
sudo npm install
- Run the following command to start your demo:
npm start
After running the above, your browser should open to the demo. If not, open your browser and navigate to localhost:3000/
Features
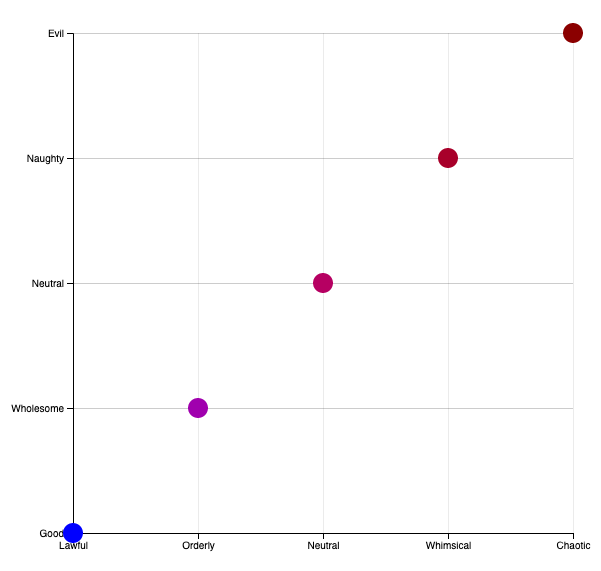
The code takes the alignment graph from our previous example, and dynamically updates it as a user fills out a personality quiz to chart their alignment on two axes. As the user answers each question, they can see the graph react in real time!
React.JS
React is an amazing JS Library (not a framework, as some often confuse) which is used to have responsive UI forms that can update the state of the app in real time. It can be used to display data, but we're going to use D3 for that. So our goals for this section of the code should be simple-- gather the data in real time, do any transformations necessary, then hand it to D3.
App.js
First, let's build our form to gather this data-- after all, you can't display what you don't have.
In App.js, we have the following code:
import React, { Component } from "react";
import "./App.css";
import Controller from "./Controller.js";

class App extends Component {
  render() {
    return (
      <div className="App">
        <header className="App-header">
          <h1 className="App-title">Character Alignment Quiz!</h1>
        </header>
        <Controller />
      </div>
    );
  }
}

export default App;
What this does is give us a container to describe the overall layout of our webapp. We'll have a header, and a Controller, which is defined in Controller.js. Let's look at that code now!
Controller.js
state = {
    scores: {
      law: 0,
      good: 0
    },
    answered: 0
  };
questions = [
    {
      question:
        "You find a bag of gold left unattended in a busy market. What do you do?",
      category: "law",
      answers: [
        "Alert the guards, and give it to them so they can find the rightful owner!",
        "Guard it yourself until someone arrives",
        "Leave it there and go about my day, it's not mine, and not my problem.",
        "I'll pick it up, but if someone goes looking for it I'll return it.",
        "Make sure no one's looking before I take it!"
      ]
    },...];
The above state variable allows React to keep track of changes made and update D3 accordingly. It contains 2 properties-- scores which contains a separate score for lawfulness and goodness-- and an "answered" property which keeps a running total of how many questions have been answered so far. This is the data you need passed to D3.
The questions array is a tad more complex. It keeps track of what each question says, what answers are available for it, what category the question answers (law or good), whether it's been answered so far or not, and what the value of its answer is. Truth be told, this variable started off simpler, but needed more properties to fix a bug where answering the same question a second time would count the answer twice. For the purposes of this tutorial, you just need to think of this as the information used to generate your form, which may be static anyways. Interestingly enough, if you wanted a third or fourth category, you could actually use this to plot data on 3 or more axes.
Let's break down the render() method together.
    var QNA = [];
    const answerScore = [0, 1, 2, 3, 4];
    for (var x = 0; x < this.questions.length; x++) {
      QNA.push(
        <div key={"q" + x}>
          <br />
          <label htmlFor={"question" + x}>
            {"Question " + x + ": " + this.questions[x].question}
          </label>
        </div>
      );
      for (var i = 0; i < this.questions[x].answers.length; i++) {
        const category = this.questions[x].category;
        const v = i; // marks what the value of their answer was
        const q = x; // marks which question we're answering
        QNA.push(
          <div key={"a" + q + ":" + v}>
            <input
              type="radio"
              className={this.questions[q].category}
              id={"question" + q}
              name={"question" + q}
              onChange={() => this.handleChange(q, v)}
              value={v}
            />
            <label>{this.questions[q].answers[v]}</label>
          </div>
        );
      }
    }
This section of the code is iterating through an array, and for each element in that array, makes a radio button group and defines its class as the category of the question, gives the answer a value (0-4), defines its onChange method, and then pushes that radio group into our "QNA" variable to be displayable later.
Important Note: The reason we have a const v and const q when we already had i and x to work with is that, if you pass handleChange(x,i), then it will always receive the value that those variables were after the loop finished iterating, not what it was on that particular iteration of the loop. If you get an error saying "element undefined", it's probably due to this.
return (
  <div className="controller">
  <div className="scrollable">{QNA}</div>
  <Viz
    law={this.state.scores["law"]}
    good={this.state.scores["good"]}
    answered={this.state.answered}
  />
  </div>
);
This is perhaps the most React-y part of the code, and it controls the hand-off between React and D3. It will display a Controller object, with a scrollable Div that contains our questions and answers (QNA), and then beneath it, loads the graph (Vis) and passes it the variables from our state object. If you've ever worried that integrating D3 with React would be complicated, the simplicity of this section of code should reassure you, because this is the heart of the integration.
Note that we could pass this data to D3 every time a form was submitted... but I wanted it to be more fluid than that. So instead of an onSubmit method, we have the following:
handleChange(q, v) {
    // update the answer for that question
    this.questions[q].answered = true;
    this.questions[q].value = v;
    var s = {}; // running total of the scores for each category
    var a = {}; // keeps track of how many of each category was answered
    s["law"] = 0;
    s["good"] = 0;
    a["law"] = 0;
    a["good"] = 0;
    for (var i = 0; i < this.questions.length; i++) {
      const x = i; // this prevents the "undefined" error.
      if (this.questions[x].answered) {
        s[this.questions[x].category] += this.questions[x].value;
        a[this.questions[x].category]++;
      }
    }
    // average the score for both categories
    // (the default value of 1 here is to avoid dividing by 0)
    s["law"] = s["law"] / (a["law"] ? a["law"] : 1);
    s["good"] = s["good"] / (a["good"] ? a["good"] : 1);

    // set the state to update the graph.
    this.setState({ scores: s, answered: a["law"] + a["good"] });
  }
This method updates the value for the questions[q] we just answered, then parses through each question in questions to tally up how many "law" questions and "good" questions were answered, as well as the values of each, which is then averaged. Basically, this is your business logic between data-collection and visualization. Then, it simply updates the state. When the state is updated, these values will be passed to D3 automatically. So let's go look at that now!
D3.JS
Now that we have the data and it's passed to D3, we need to tell D3 how we want it displayed.
Vis.js
This code should look incredibly similar to the code in our [D3 Example](INSERT LINK HERE), because it is mostly copy-pasted from there. As such, we're not going to go over the renderAxes or renderPoint methods again. Instead, let's focus on the differences.
  // First, render the Y and X axes.
  renderYAxis();
  renderXAxis();
Notice that now we call the renderYAxis and renderXAxis methods in the body of the class, but do not call the render point immediately. This is because if nothing is answered yet, there is no data to display, but we always want to draw the axes once (and only once). If there is data, we'll handle it in the below code:
const Viz = props => {
  useEffect(() => {
    var law = props.law,
      good = props.good,
      answered = props.answered;

    // first question answered, so render it.
    if (answered == 1) renderPoint(law, good, 100 / answered);
    // otherwise it already exists, so move it.
    else if (answered > 1) movePoint(law, good, 100 / answered);
  });
  return <div className=".viz" />;
};
Essentially, this method takes the parameters passed by React to the <Viz> object and maps them to local variables, then makes a choice. If this is the first question we've answered (ie: answered==1), then we'll use the renderPoint method which works exactly the same way as it did in our D3 tutorial. If it isn't the first question answered, then we get to have some fun with D3 by calling the movePoint method, which we'll go over in a second. Once it's done, it returns <div className=".viz">, which essentially tells react to display this graph.
When we get new data, we don't want to call renderPoint again, because it would draw a new circle, rather than updating the position of existing one.
function movePoint(x, y, size) {
  var t = d3
    .transition()
    .duration(750)
    .ease(d3.easeLinear);

  d3.select("circle")
    .transition(t)
    .attr("cx", xScale(x))
    .attr("cy", yScale(y))
    .attr("fill", colorscale((x + y) / 2))
    .attr("r", size);
}
In the move method above, we take the same parameters as the renderPoint method, but instead of appending a new circle, we select the original one, apply a transition that is linear with a set duration, and then update the attributes through that transition. The end result is that our circle glides to its new position while updating its color and size smoothly. You could argue that we could simply select the circle and set it's "cy" and "cx" attributes to reflect the new data, but I'd argue that anyone who prefers that hates fun.
That's all for now, if you have any questions or comments, feel free to leave them below!


Comments