
Top Announcements:
The Keynote Address started the week off, coinciding with the start of Coalesce+ London. Tristan Handy, CEO and Founder of dbt Labs, and Margaret Francis, Chief Product Officer at dbt Labs, discussed the modern data stack, how it has changed, and upcoming additions to the data tooling ecosystem. Additionally, the following new dbt features were announced.
Python Support in dbt
With the release of v1.3 of dbt Core, you can now create and execute Python models in dbt. This feature is available for users on BigQuery, Databricks, and Snowflake. Python models are:
.pyfiles in a dbt project, typically in themodels/directoryreturnsa data object in the form of a dataframe in the data platform- compiled by dbt, in the
target/directory and then executed in the data platform
Python support was not included to change how dbt functions, but introduced to handle problems better solved in Python, such as:
- Advanced statistical calculations
- Parsing and analysis of text inputs
- Complex date-time operations
- Basic forecasting models
- Generating synthetic data
- Enrichment of datasets via metadata
- Feature engineering for ML
- Light ML workloads
For more information, check out this article.
New dbt Cloud IDE
dbt also announced the release of their new and improved Cloud IDE available to all users now. They've made performance upgrades, ergonomics improvements, and some quality-of-life enhancements to improve the user experience.
For more information, check out the new Cloud IDE here.
dbt Semantic Layer
The final product announcement in the keynote was of the dbt Semantic Layer. dbt prides itself on streamlining governance and managing the complexity of analytics data pipelines and business logic. The dbt Semantic Layer extends the portfolio of information managed in dbt. With the new semantic layer, you can find the information you need to make quality decisions. You can define metrics in your dbt project, and then data consumers can query those metrics in downstream tools.
dbt is additionally working with partners to ensure that integrations with the dbt Semantic Layer meet organizations' needs.
Look here for more information on the dbt Semantic Layer and integrations and use cases that the dbt Semantic Layer powers.
Recap
Now that we have seen the new features coming to dbt, I want to discuss some of my favorite sessions from the 100+ at Coalesce 2022.
SQL: The Video Game
Who hasn't been playing Wordle daily over the past year? Are you a data or analytics engineer who wishes there was something similar for SQL skills? That is the inspiration behind QUERY; a video game aiming to help data folks keep their querying sharp and newcomers increase their literacy.
Joe Markiewicz, Analytics Engineer at Fivetran by day and video game developer at Cedar Cat Studios by night, leveraged dbt and BigQuery to create the game, and his session was fascinating. I enjoyed hearing about his inspiration as well as the technical implementation.
Watch his talk here!
To install QUERY; go to the Apple App Store
Building Scalable Data Products leveraging User Stitching
Tracking a user's journey can be rather tricky. Emiel Verkade from Snowplow discussed how Snowplow handles user tracking and user stitching in this talk. There are many ways people can enter into the domain of dbt. You can go directly to the docs site, or you are Googling the problem, which leads you to an answer you can try. You can also span multiple search sessions and multiple days to resolve a problem. Basic web analytics would look at each day's session separately. If you use user stitching, you can trace the pattern of use through a site and surmise if a visitor found a solution.
At a high level, user stitching (or identity stitching) says that if two events belong to the same identifier, they belong to the same entity. In this way, multiple identifiers can be defined per customer.
How do you approach user stitching? Emiel recommends the following:
- a set of properties to identify a user
- an understanding of how the identifiers map to each other
- a way to identify all events for a user.
At Snowplow, they use the domain_userid (set by first-party cookies), network_userid (set server-side by the Snowplow collector), the idfa/idfv (set by mobile devices), and the user_id (set to a custom id when tracking). They then map the identifiers like so:
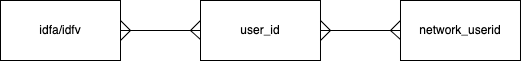
Snowplow then runs a query using the mapping presented above to generate a table containing the domain_userid, the most recent user_id, and the processed date. This table allows Snowplow to see a person's identifier before they even log in for the day. To scale this, Snowplow has a custom incremental materialization called snowplow_incremental which reduces the amount of data scanned. All of this is powered by dbt!
For more information on Snowplow's approach to User Stitching, watch the full talk here!
Beyond the buzz: 20 real metadata use cases in 20 minutes with Atlan and dbt Labs
In this talk, Prukalpa Sankar, Co-founder of Atlan presents 20 scenarios in which data teams have used metadata to drive their work as well as how metadata and the dbt Semantic Layer can transform how a team works with metrics.
The chief question that Prukalpa and Atlan is trying to address is, When I'm looking at data in a dashboard and am wondering if it is correct, is it possible to get the answers immediately?
Let's get right into five of the real-life use cases mentioned in the title that I found most impactful (all powered by Atlan, of course!):
- Speed data team onboarding and ramp up
Problem: How do you speed up team onboarding and ramp-up?
Typically analysts spend 18 months on the job, and it takes them 6 months to onboard into an organization.Solution: By making assets (such as your data objects, metrics and queries) available, you can reduce this time astronomically.
- Speed up root-cause analysis
Problem: Finding the solution to
It doesn't seem like Metric X is right?is far from easySolution: Establish an automatic lineage across all of your data assets so you can easily trace the data's journey through your process.
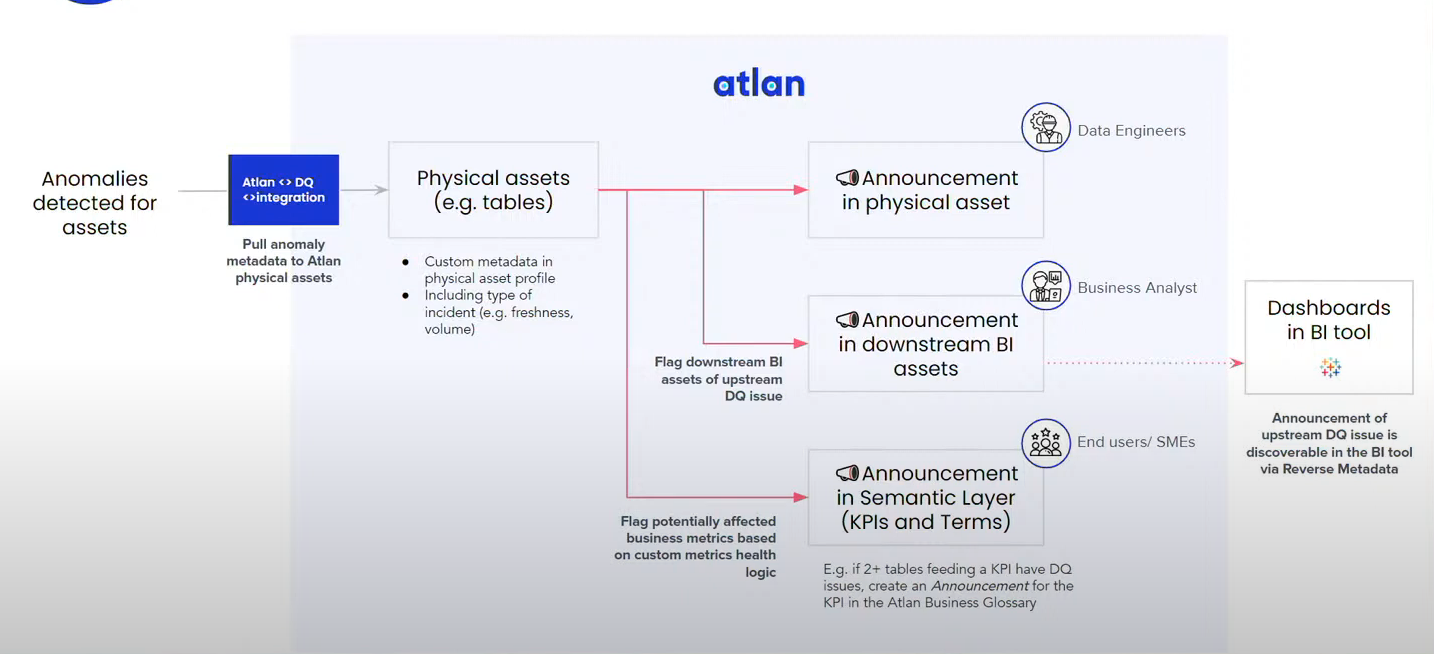
- Active data trust management
Problem: How do you go from metadata as a knowledge repository to activating the metadata to create actions in your environment?
Atlan has a customer with a data quality tool which generates anomalies. The anomaly comes in at the physical data table.Solution: The customer configured an automated action which connects the anomaly announcement to the downstream BI assets as well as the business metrics that those tables are connected to.
- Write better SQL queries with context
Problem: As a data engineer or data analyst, how can I do my job better?
Solution: Make the metadata context available to tools used on a daily basis. Integrate your metadata into your IDE so you can see recent queries run on a table, whether a table is popular, who owns it, are there issues with the table, what a metric means, the column description and many other things.
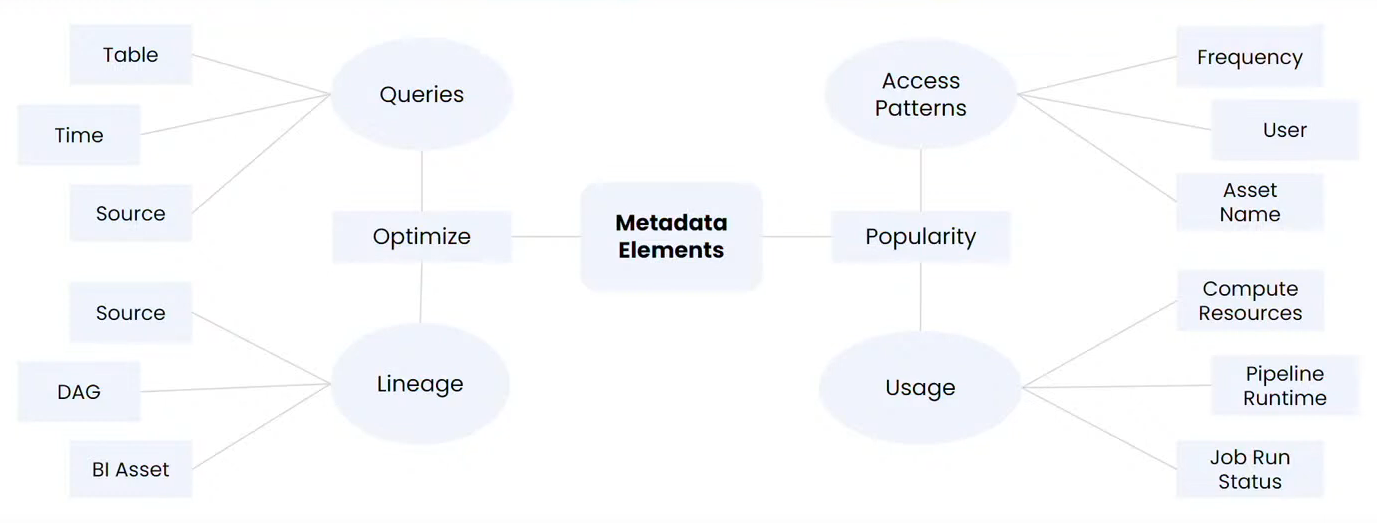
- Optimize data stack spending
Problem: How can you identify the following:
- Which queries are taking too long to run?
- Which tables can we deprecate?
- How long are jobs waiting to execute?
- What tables are used by BI tools?
- What are the most/least queried tables?
Solution: All of this should be generating metadata in your system. You can then leverage that metadata to better optimize usage.
As mentioned in the title, Prukalpa blitzes through 20 such use cases in approximately 20 minutes. To learn about all 20 use cases, watch Prukalpa's full talk here. For more information on all that Atlan can offer, look here.
Detecting Data Anomalies via an Inspection Layer
In most of our current data ecosystems, we ingest data from various vendors, IoT devices, and more. Unfortunately, for every data source that is perfect, there is another (and we've all been there) where the data isn't what we were expecting. When the data has nulls, contains duplicates, or has a different schema than initially communicated, your data pipeline can stumble. You can handle this natively with dbt native methods and implement an inspection layer to ensure that 'bad' data is flagged and quarantined while the remainder is loaded uninterrupted.
Neal Achord and John Rensberger from Red Pill Analytics walk us through their implementation of the inspection layer in this workshop. It was fascinating to see and implement this myself.
You can follow along with the workshop by watching their talk, cloning the repo on Github and referring to their slides.
I'm cognizant that all of the above is a lot. Thanks so much for sticking with me as I condensed a jam-packed week of content into a short little blog like this. I had a ton of fun and while I felt like I was drinking from a firehose at times, Coalesce was the best experience I've had at a conference to date. I thoroughly enjoyed getting to chat with data professionals and commiserating over all of the common data problems we face daily. All of the sessions and workshops where immensely thought-provoking and interesting. I hope I'll get to attend again sometime soon!
Interested in all the talks that happened this year? Find the full Coalesce 2022 Session playlist here!
For more information on how Ippon Technologies can help your organization utilize dbt for all of your data transformation needs, contact sales@ipponusa.com.


Comments